Technical analysis is a fundamental ally for traders as it provides, starting from statistical bases, signals capable of guiding choices. The main ingredient of technical analysis is indicators, which are tools capable of deriving real signals from the market. The landscape of indicators is vast. What is the best forex indicator, the one capable of offering the best evidence? In reality, there is no single indicator that is better than all the others. However, it is possible to identify the 5 most effective ones.
Moving Averages
It is the most widely used indicator, or rather class of indicators. A moving average is nothing more than the average of prices over a predefined period of time. The term "moving" is justified by the fact that it is recalculated with each update, based on the set timeframe. Moving averages provide entry and exit signals. The signals arise from the interaction between multiple moving averages (e.g., crossovers).
RSI (Relative Strength Index)
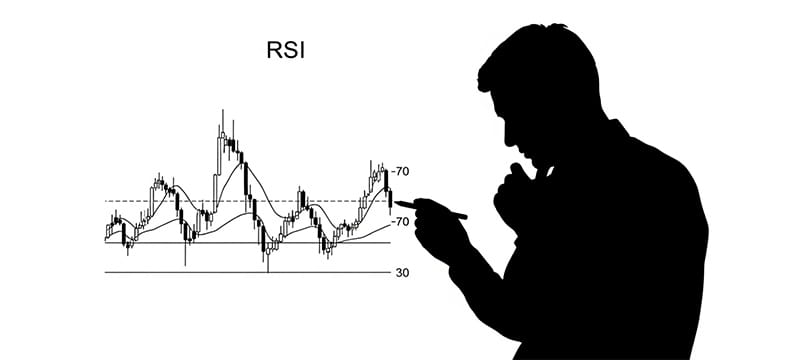
The Relative Strength Index is one of the most appreciated indicators. Its function is to identify overbought and oversold situations. If the asset is in one of these phases, it is possible to obtain clear reversal signals. The RSI is therefore very useful for exploiting breakouts, as it is capable of predicting them or defending against them. The RSI is almost never used alone but requires other indicators capable of corroborating the evidence (the risk of false signals is high).
ADX (Average Directional Index)
The Average Directional Index aims to measure the strength and direction of a trend. It is composed of three components: ADX, +DM, -DM, each of which is represented on the chart through lines. Like moving averages, when these lines interact with each other, or better, with the price, more or less reliable signals are generated.
Bollinger Bands
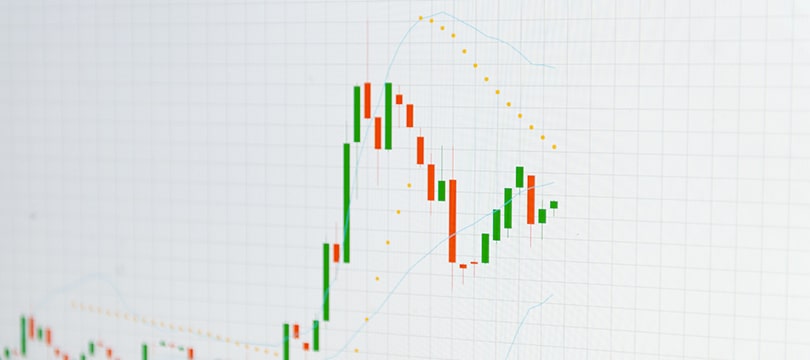
This indicator measures volatility. It is, in fact, the result of a complex calculation that sees the standard deviation of the price as the protagonist. Bollinger Bands represent a highly appreciated indicator because it offers dynamic support and resistance levels.
MACD (Moving Average Convergence Divergence)
The Moving Average Convergence Divergence is an indicator formed by three moving averages, respectively at 12, 26, and 9 periods. The signals emerge mainly from the interaction between the 9-period moving average and the difference between the other two moving averages. It is often used together with the RSI. For one experienced trader's take on combining indicators like these, see this veteran trader's playbook.