Candlestick Analysis, the study of candlestick charts, originated in Japan when there was no official currency for trading and rice was the true reference in commerce, eventually leading to the creation of the first rice futures market. In the 18th century, a rice merchant named Munehisa Homma began studying the rice market from fundamental to technical aspects. Homma became very wealthy thanks to the price forecasting system he implemented, earning him recognition as the "father of candlestick analysis". With the advent of the Japanese stock market in 1870, Candlestick Analysis was adopted by Japanese technical analysts.
Compared to bar charts, candlestick charts offer a better representation of the ongoing battle between Bulls (buyers) and Bears (sellers), and more importantly, more precise and accurate trend reversal signals, better satisfying the needs of day-traders. In particular, with Forex being a very fast-paced market with frequent trend reversals within a single session, candlestick analysis can be a decisive ally for the forex trader to always start with a competitive advantage over the market.
As with bar analysis, to construct a candle on a price chart, we need the following elements: open, close, high, low. The characteristic of candles is the real body, a rectangle that connects the opening and closing prices. A bullish candle usually has a white or green real body, while a bearish candle has a black or red body. The real body is simply the price range between the open and close. The vertical lines extending above and below the real body are called shadows. The upper shadows are called upper shadows, and the lower ones are called lower shadows.
Starting from this basic information, it is possible to construct a series of candles that can be grouped into two main sections:
- Trend continuation candles
- Trend reversal candles
In general, to obtain actionable signals with candlestick analysis, wider chart patterns are used, i.e., composed of multiple candles (usually three). However, there are also some single candles that have great operational value both as a continuation of the main trend and as a trend reversal.
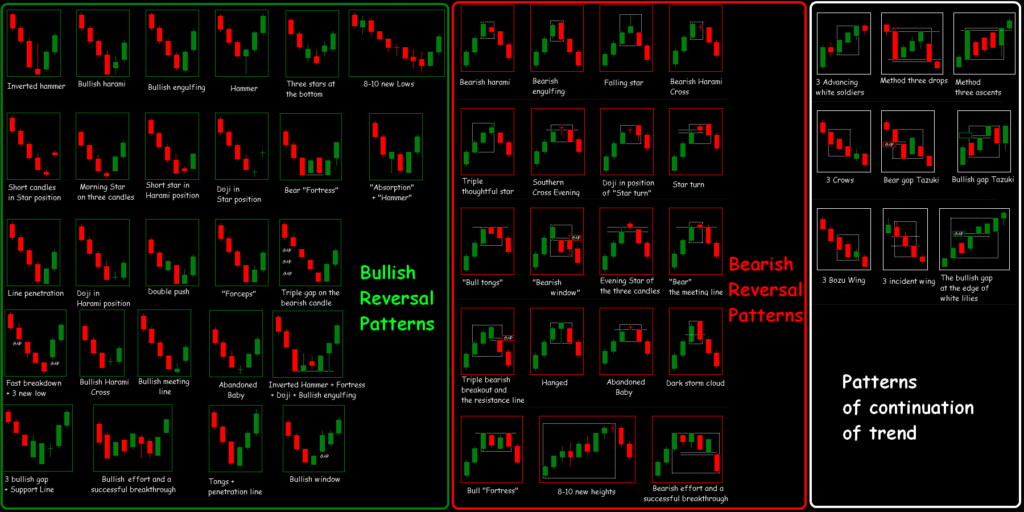
Candlestick analysis patterns
- Doji, Spinning Top, High Wave Candle
- Hammer, Inverted Hammer, Shooting Star, Hanging Man
- Harami Top, Harami Bottom, Harami Cross
- Bullish Engulfing, Bearish Engulfing
- Piercing Line, Dark Cloud Cover
- Bullish Counterattack, Bearish Counterattack
- Three Morning Star, Three Evening Star
- Tweezer Top, Tweezer Bottom
- Three White Soldiers, Three Black Crows