In the exciting world of trading, there are many techniques and tools available to traders for analyzing and predicting market movements. One of the pillars of technical analysis is the ability to
correctly plot support and resistance levels. In this article, we will delve into the world of these fundamental concepts, exploring their meaning, how to calculate them, and how to optimize their use in trading strategies.
Why Plot Support and Resistance Levels
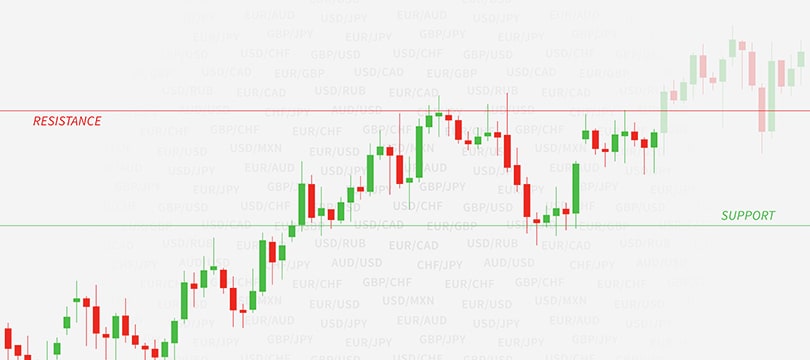
Support and resistance are, respectively, the price levels at which a security or market struggles to fall or rise. In other words, they represent psychological or real barriers that prevent the price from continuing in a certain direction.
While
support indicates a level at which a security has difficulty falling (and is therefore an area where the price is likely to bounce),
resistance indicates a level at which the security has difficulty rising.
Plotting support and resistance allows traders to identify possible market turning points, areas of accumulation or distribution, and potential opportunities to enter or exit the market.
How to Calculate Support and Resistance Levels
There are various methods for calculating support and resistance levels, which correspond to actual types.
- Historical Method. One of the simplest and most common methods for plotting support and resistance is to analyze past price levels. If a certain level has acted as support or resistance in the past, it is likely to do so again.
- Volume Method. By observing trading volumes in conjunction with price movements, it is possible to identify key levels. An increase in volume near a support or resistance level can strengthen the validity of that level.
- Moving Averages Method. Often, particular moving averages (e.g., the 50-day or 200-day moving average) can act as support or resistance.
- Fibonacci. The Fibonacci sequence and its extensions are often used to predict possible support and resistance levels.
- Psychological Method. Even round or symbolic values can act as support or resistance, according to purely psychological mechanisms. For example, 1.00 acts as support for the euro-dollar.
Strategies for Optimizing the Use of Support and Resistance Levels
The first step is to plot support and resistance levels, the second is to use them to set up your trades. Here are the main uses of support and resistance levels.
- Breakouts and Breakdowns. When a price breaks through a resistance or support level with significant volume, it could signal the beginning of a new trend. These points can offer opportunities to enter the market.
- Bounces. If the price approaches a support level and shows signs of bouncing, this could represent a buying opportunity. Similarly, a price approaching a resistance level and starting to decline could be a sell signal.
- Stop Loss and Take Profit. Support and resistance levels can help traders position stop loss and take profit orders. For example, placing a stop loss just below a support level or a take profit just before a resistance level.
- Confirmation of Other Indicators. Using support and resistance levels in conjunction with other indicators (such as RSI, MACD, or stochastic) can offer additional confirmation and increase the probability of successful trades.
Common Mistakes in Using Support and Resistance Levels
Correctly plotting support and resistance levels is one of the most valuable skills for a trader, but it is also one of the areas where most mistakes are made, especially among beginners. Here are some of the most frequent mistakes:
- Too Much Specificity. Support and resistance indicate precise price levels, but it is important to remember that they often work better as "zones" rather than thin lines. Overly rigid predictions can lead to misinterpreting market movements.
- Relying on a Single Data Point. Basing the plotting of a support or resistance level on a single historical point, without considering other factors or confirmations, can be misleading. It is always better to look for multiple points of contact before considering a level as valid.
- Ignoring Market Context. In highly volatile or news-driven markets, support and resistance levels can be easily breached. Not taking into account the broader context can lead to misinterpretations.
- Not Updating Levels. Markets are dynamic and, as such, support and resistance levels also evolve over time. Not regularly updating these levels can lead to relying on outdated information.