Technical analysis is the study of price movements aimed at identifying those recurring chart patterns characterized by a high probability of success. From a statistical point of view, the basic concept is that if a certain event has occurred in the past, under the same conditions, it will continue to happen, showing the same effectiveness in general.
However, technical analysis is not an exact science but an art that seeks to predict, through repetitive market behavior, the possible evolution of prices following the formation of certain chart patterns. Working on financial markets using technical analysis means completely ignoring macroeconomic news.
A technical analyst does not consider the news as they believe it is already incorporated in the latest price movement: when the news is released, it is considered to be already fully discounted by the market. In fact, there is a category of investors, the so-called "insiders" (presidents, CEOs, large shareholders, financial directors, managers, and senior executives), who have access to confidential information capable of creating the conditions for a price movement based on the expected news even before it is officially communicated to the market. In Forex, insiders are large investment banks, hedge funds, central banks, and other policymakers.
However, it should be considered that this is an excessively liquid market, so it is very difficult for an insider to benefit from confidential information as it happens, for example, in the stock market. Proponents of technical analysis believe that its effectiveness depends on the ability to understand market psychology. Market psychology can be cataloged in the different moods of investors (euphoria, panic, depression, greed, hope, exuberance, etc.) through the identification of particular price chart formations.
Moreover, the widespread use of technical analysis, even in companies with great "fundamental" influence in market analyses, makes it almost a self-fulfilling prophecy.
A Forex Trader will have to focus mainly on technical aspects, although it is still important to follow the trend of the main macroeconomic data to make their strategies more competitive. The father of technical analysis is Charles Henry Dow (1851-1902), made famous by his "Dow Theory", which is still widely used among investors and technical analysts today.
The fundamental principles of Dow Theory are as follows:
- The averages discount everything;
- The market has three trends;
- The main trends have three phases;
- The averages must confirm each other;
- Volumes must confirm the trend;
- A trend is in place until proven otherwise.
When Dow spoke of "averages", he was referring to sector and market indices, so averages (i.e., indices) discounting everything means that prices already incorporate all available information.
Technical analysis tends to graphically represent prices in different ways. The most well-known and used graphical representations by traders are:
- Line chart
- Bar chart
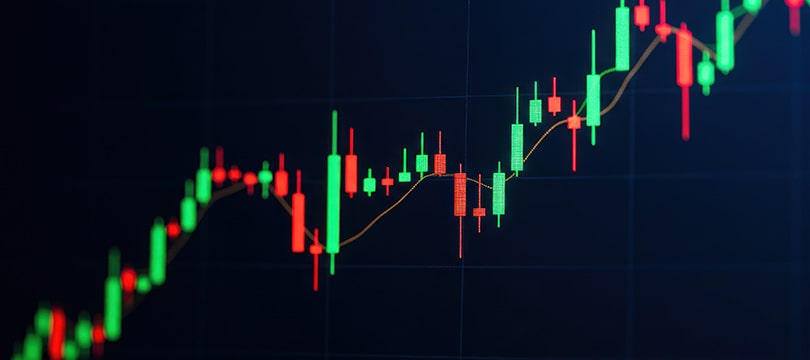
- Candlestick chart
- Point & Figure method
The line chart is the simplest but also the least interesting for carrying out analyses with operational implications. It is formed by the conjunction of a series of points, where each point provides data on a single element of the negotiation (it is almost always built on closing values). It can be useful in preliminary analyses to quickly identify the main trend and any turning points in the market.
The bar chart offers more information than the line chart and is already more than sufficient to carry out market analysis for operational purposes. In a bullish bar, which has sanctioned the predominance of buyers, the close is a dash placed on the right of the bar while the highest point of the extension is the high; the open is lower than the close and is placed on the left of the bar while the downward extension is the low. The bearish bar is the diametrically opposite version, so the considerations made for the bullish bar are completely overturned.
The candlestick chart, on the other hand, groups the fundamental information into a single candle.
The point & figure chart is a very old system for visualizing price movements. Widely used in the past by floor traders, i.e., those traders who worked directly on the exchange pit, it is a price-driven analysis system. This means that it takes into account only and exclusively prices without considering either time or volumes. There are also other types of graphical representations (such as Renko or Kagi), but traders only use bar or candlestick charts.


