The double bottom is an opportunity for traders. And it all starts with a pressing need, namely the identification of the correct entry point into the market. It's a matter of timing, of course, but also of analysis and understanding of the real trend in the market.
For example, it's never easy to identify the right time to buy, that is, when the price has hit a low and is ready to reverse the trend. However, the issue can become simpler if the asset behaves in a certain way, if it draws a specific figure on the chart.
This article covers exactly that kind of figure. Specifically, the focus is on the double bottom, with a clear and concise definition and advice on how to recognize it and exploit it properly.
A definition of double bottom
So, what is the double bottom? Those who have been trading for some time, and those who, although beginners, have completed a comprehensive and advanced training course, already know the answer. However, the definition does not pose obstacles to understanding; in fact, in some ways it is even intuitive.
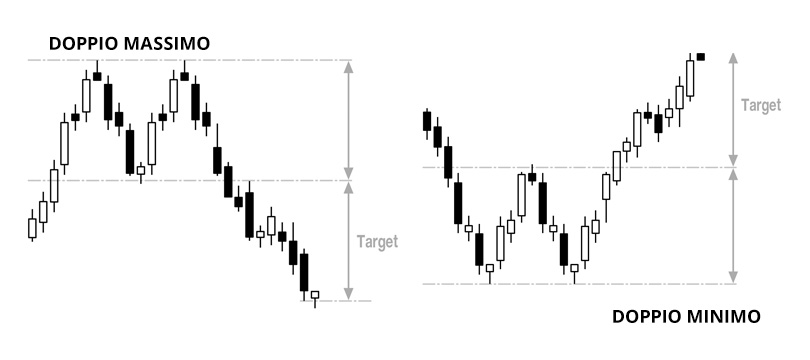
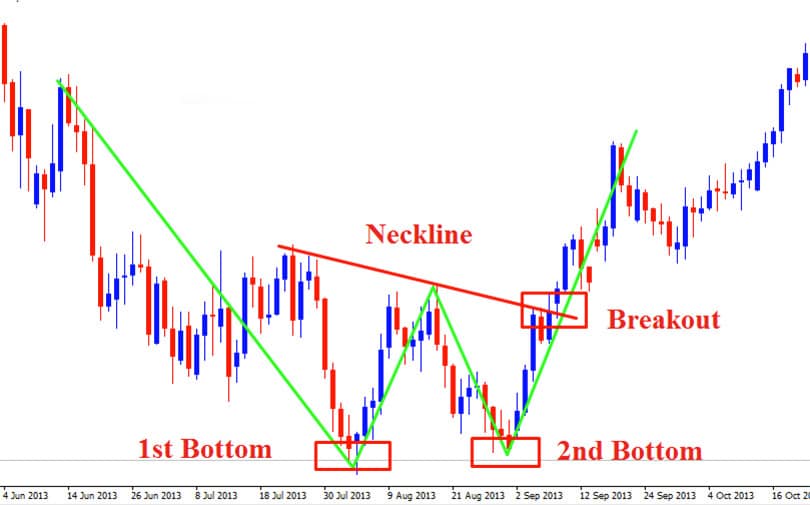
The double bottom is a figure that forms on the chart. A figure built from a downtrend, a first low, a rebound to the level that becomes the neckline, a second low at roughly the same level, and a break above the neckline that confirms the reversal. From a purely visual perspective, the double bottom resembles a skewed "W", with one tip shorter than the other.
Why is the double bottom important? In a way, this question has already been answered. The double bottom is important because it "announces" a trend reversal and, at the same time, reveals the level from which the rise starts, which is the second bottom.
By virtue of this information, the double bottom represents both an analytical and operational tool. Analytical in that it informs about the moment the market is experiencing, namely the imminence of a breakout. Operational in that such information circumscribes the ideal entry point.
Thanks to the double bottom, therefore, the trader can achieve the most valuable and difficult goal: buying low and selling high. In short, they can capture a more or less substantial profit. How large that profit ends up being also depends on the leverage applied to the position; see why high leverage is crucial.
This, to be clear, is not always the case. "Generally", "usually" are the most appropriate expressions. It should be remembered that technical analysis, as well as graphical analysis (which is a branch, a subcategory), are not "hard" sciences, they do not offer certainties. Probabilities, however, yes. False signals are always lurking, ready to invalidate and cause the failure of a trade.
Of course, it also depends on the characteristics of the double bottom. In fact, not all double bottoms are equal, and some are more reliable than others. It is therefore worth describing the "perfect" double bottom, the one that, generally, produces the smallest margin of error.
Well, the ideal double bottom presents itself with:
- Enough separation between the two lows for them to be distinct swings, not two bars of the same dip.
- A visible rebound between the two lows: on forex, a few tenths of a percent is already meaningful.
- The two lows at roughly the same level (the pattern scanner on this site accepts a difference of about 0.15%).
Indeed, the truly "perfect" double bottom, but, it must be said, rather rare, sees the two lows separated by enough bars to be distinct swings, on whatever timeframe you are reading.
It should be specified that the double bottom in itself is not such a frequent figure. Generally, the price line is either more linear or more chaotic. This figure represents a rare point of balance between the two extremes. Precisely by virtue of its rarity, it is welcomed like manna from heaven when it appears to be forming on the chart.
Why double bottoms are important and how to use them
The answer to this question, at this point, is easily intuitable. The double bottom is important as it offers the possibility to enter at the lowest point, that is, before a trend reversal.
Entering the market before a trend reversal from negative to positive, that is, when the downward trend becomes upward, can offer a favorable entry, though never a guaranteed gain (the outcome depends on the reversal following through and on the exit point, which is in turn complicated to identify).
Therefore, the advice is to seize the opportunity when it appears on the horizon.
In detail, how are double bottoms used? There are two alternatives.
- Enter long on the second bottom. In theory, it is the most profitable alternative, as it allows you to pocket as many pips as possible, and to really access the first available opportunity. Taking advantage of the double bottom, however, means not waiting for the figure to be completed, and thus risking that it will not be completed at all.
- Enter on the pullback, that is, at the end of the last correction, just before the trend has stabilized. Occurring at the end of the figure, it is the most "balanced" moment, that is, when the margin of error is minimal. Of course, a few pips are lost along the way.
How to avoid false signals
However, the problem of false signals remains. What looks like a double bottom may not be one. Even a true double bottom could lead to nothing.
Well, avoiding false signals (double bottom or not) completely is practically impossible. Reducing their incidence, to the point where they do not harm too much, is an achievable goal.
How to do it? In the case of the double bottom, just verifying that the pattern meets the standard criteria on the chart would be useful. As a general rule, it is good to take a specific precaution. Namely, use multiple indicators, so that one confirms the other. If a signal is returned by two or more indicators, then the risk of failure is reduced.
Generally, one should use a price indicator together with a measure of activity. On spot forex there is no centralized volume, only the tick volume of your broker, so read it with care. A trend often ends in one of two ways: exhaustion, where activity fades as sellers run out, or capitulation, where a final burst of selling marks the low. The break of the neckline that confirms the pattern is more credible when activity picks up.
It's worth repeating: technical analysis is not a science, but a discipline of statistical derivation. There are no certainties, only probabilities.