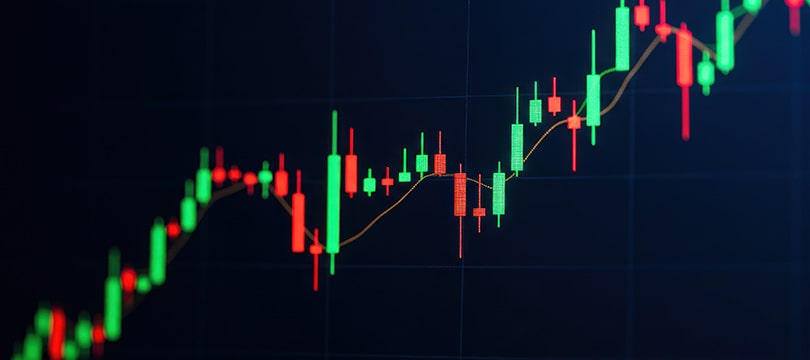
Technical analysis is a complex activity. And it couldn't be otherwise, since the purpose for which it was born is ambitious:
to read the market, to predict with a sufficient margin of error how prices will move. The main resource for producing a good technical analysis is represented by indicators. They are powerful tools that offer potentially reliable signals. However, they are not perfect. To smooth out imperfections,
it is a good idea to combine them with each other.
In this article, we offer an overview of indicator combinations and some useful examples for those who want to produce a technical analysis worthy of the name.
Why indicators are important
Indicators are tools that process the data presented in the chart according to complex calculations and equally complicated statistical models. They are generally offered by brokers and integrated into individual platforms. Obviously, it is possible to use
third-party indicators.
The purpose of indicators is to provide entry and exit signals and, in doing so, offer indications about future market movements.
Indicators do not predict. The concept of prediction is foreign to trading. One should speak, rather, of probabilistic estimates. All the information obtained from technical analysis and through indicators, as long as everything goes smoothly, simply has a high probability of proving true.
The offer of indicators is practically endless. This should not be surprising. The market is complex, and there are numerous trading styles. Therefore, the offer of indicators is based on the path traced by these complexities and tries to adapt to the variety of situations and conditions.
Why combine indicators and how to do it
Indicators are powerful tools, but far from infallible. There are numerous variables that confute reasoning, or rather a calculation, that should work on paper. Moreover, often each indicator focuses on one element, paying less attention to the others. If you use only one indicator,
the risk of receiving false signals is high. This is a risk to be avoided at all costs, because it leads the trader to open wrong positions and, consequently, to lose money.
Fortunately, there is a solution to all this. There is an approach that overcomes (at least potentially) the limitations of indicators. An approach adopted by all traders who prove able to generate profit and who conduct a sustainable trading activity. This approach involves
combining at least two indicators. That's right, indicators are best used in pairs. Inserting a third would mean complicating the situation, creating management difficulties, and increasing the risk of generating conflicting signals.
With what ratio are the indicators combined? There are two principles. The first, the most important one, responds to the need to perform a real cross-check. If an indicator generates a buy signal, perhaps a strong one, this is truly valid only if it is confirmed by another indicator of a different sign and with different characteristics. If two indicators using different mechanics reach the same conclusion, then there is a high probability that that conclusion is correct.
The
second principle suggests combining
different indicators that analyze the market from two points of view that have little or nothing to do with each other. The main scheme, in fact, involves the use of an indicator based on prices, such as the MACD, together with an indicator based on volumes, such as the RSI.
Be careful: using combinations of indicators does not mean
complicating. Making technical analysis more complex usually does not generate positive consequences. On the contrary, the risk is to waste time and energy, find yourself with conflicting signals, and opt, perhaps unconsciously, for discretionary position-taking. This is a drift to be absolutely avoided. Trading, and technical analysis in particular, should be an activity that, if not scientific, is at least rational, based on the principles of statistics.
The best indicator combinations
What are the best indicator combinations? Obviously, it is not possible to answer this question. Indicators, in order for technical analysis to be profitable, must be compatible with the goals and style of the individual trader. However, some combinations are more widespread and appreciated than others. Here are some examples.
Moving Average and Stochastic
This is the ideal combination. In fact, the moving average analyzes the current trend, even with respect to what happened in the immediate past, while the stochastic, by analyzing the volumes, anticipates trends. The ideal setup involves setting two moving averages at 14 and 50 periods, and a classic stochastic at 20-5-5 (overbought at 80 and oversold at 20).
A
buy signal is received when the fast moving average crosses the slow moving average from the bottom up, and at the same time the stochastic, although upward-oriented, does not reach the overbought threshold.
A
sell signal is received when the fast moving average crosses the slow one from top to bottom, and at the same time the stochastic is downward-oriented without touching the oversold level.
In the first case, you could set the stop loss at the level of the last price before the rise (which can be considered a sufficiently reliable support). In the same and opposite way, in the second case you could set the stop loss at the level of the last price before the decline.
Bollinger Bands and Stochastic
The mechanism underlying this combination is similar. Again, we find ourselves facing a price indicator, namely the Bollinger Bands, and a volume indicator, namely the Stochastic. The raison d'etre of this combination, at least compared to the previous one, lies in the greater complexity of the Bollinger Bands compared to moving averages. A complexity that on the one hand guarantees a greater amount of information, and on the other increases the probability of human error.
In any case, as far as the setup is concerned, it would be good to set the Bollinger Bands with a 4-hour horizon, 20 periods, and 2 standard deviations. The stochastic, on the other hand, should be set with parameters 13-5-5.
A
buy signal is received when the price exceeds the lower band and returns to its path and, at the same time, the stochastic signals an oversold condition.
A
sell signal is received when the price exceeds the upper band but then returns to its path, and at the same time the stochastic signals an overbought condition.
More complex is the determination of stop losses. One could refer to the candlestick pattern that always forms in this situation, use the bands themselves as supports and resistances (but this would be too "broad" an approach), or use the Average True Range indicator.
MACD and RSI
The strategy underlying this combination is seemingly simple, yet the principles that drive it are quite complicated. In fact, 3 elements must be considered: the market strength returned by the RSI, the state of the trend given by the MACD moving averages, and the price itself.
In any case, the ideal setting involves a MACD with three moving averages at 12, 26, and 9 periods respectively; and an RSI at 14 periods with overbought at 70 and oversold at 30.
The goal is to intercept the trend reversal.
A
buy signal is received when the market is bearish but, at the same time, the RSI is increasing and the MACD line is crossing the signal line from bottom to top. The entry point should correspond to the intersection between the MACD lines.
A
sell signal is received when the market is bullish but, at the same time, the RSI is decreasing and the MACD line crosses the signal line from top to bottom. Again, the entry point should correspond to the intersection between the MACD lines.
Parabolic SAR and Moving Averages
The Parabolic SAR is a very powerful indicator. However, it offers (practically certain) information only on the
current trend. For this reason, if the goal is to produce a predictive technical analysis, it is better not to use it alone. The risk of receiving false signals, in fact, would be too high. The combination with moving averages is an excellent solution to implement a quick, easy-to-understand, and effective strategy.
The SAR should be set in a classic way, or at most impress a slight acceleration at 0.01 or 0.05 to further reduce the risk of false signals. As for the moving averages, two are enough, as long as they are "very different", i.e., one at 10 periods and one at 100 periods.
The
buy signal is given by the permanence of the 10-period moving average above the 100-period moving average, in conjunction with a SAR that stays below the price.
The
sell signal is given instead by the permanence of the moving average and price below the 100-period moving average, in conjunction with a SAR that stays above the price.
As can be seen, this combination is especially suitable for "trend following" approaches. In fact, the SAR is rarely able to intercept trend reversals.


