Forex Trading: Understanding and Using Pivot Points
October 4, 2017
Forex Trading is all about technical analysis. It's a fundamental discipline, a small light in the dark imposed by the (apparent) unpredictability of the market. It's a set of techniques that allows you to understand where the market is going and predict, with a bit of luck, price trends. Technical analysis uses tools, which can be more or less complex: indicators developed based on refined statistical models, moving averages at multiple speeds, and... Pivot Points. These represent the middle ground between complexity and ease of use, in a context where effectiveness plays a priority role. Here's a brief guide on Pivot Points that answers the following questions: what are they really? How are they calculated? How are they used?
What are Pivot Points
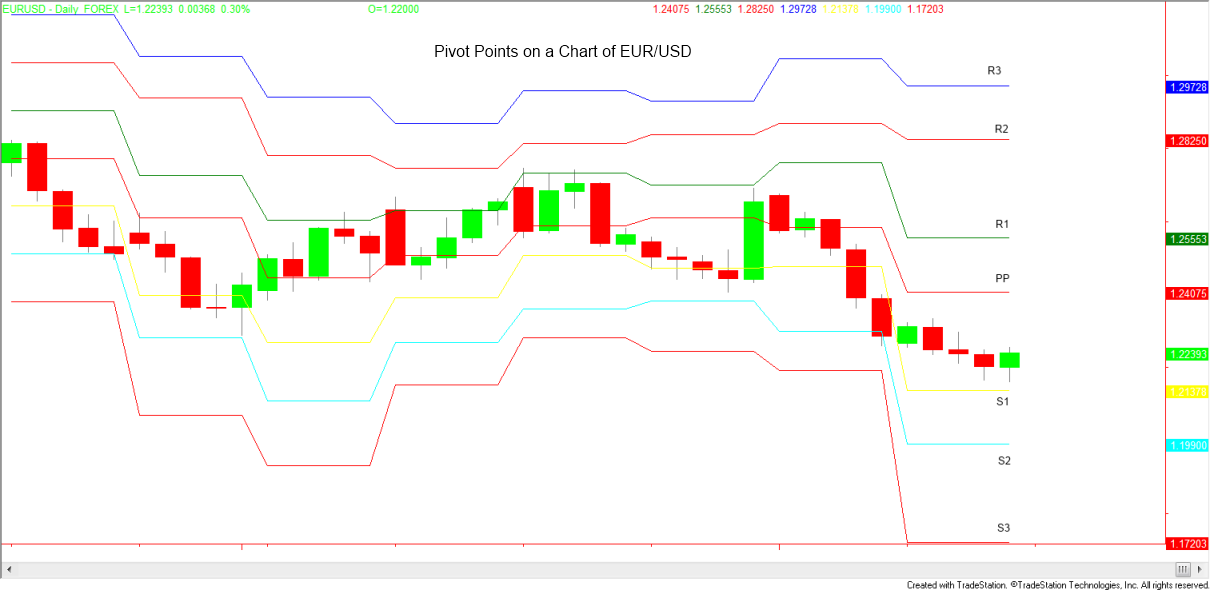
Pivot Points are price levels "around" which something special happens; specifically, where the market reacts more intensely. When prices reach Pivot Points, the market comes alive, revealing its true intentions, which in this case means "revealing the trend".
In reality, Pivot Points are nothing more than support and resistance levels, terms with which even less experienced traders have some familiarity. Compared to commonly used supports and resistances, however, Pivot Points are more complex and the result of calculations that take into account a greater number of elements. The supports and resistances as understood by everyone are actually an oversimplified version of Pivot Points. They are nothing more than minimums and maximums, usually weekly.
Now, a question arises spontaneously. Is it better to use supports and resistances derived from minimums and maximums, or Pivot Points? Operationally, little changes, in the sense that the same techniques are used for both. However, it's a matter of precision and effectiveness.
Well, Pivot Points are much more precise. This is true, of course, because as mentioned earlier, they are the result of calculations that process elements of a different nature. On the other hand, supports/resistances derived from minimums are easier to identify, therefore immediately usable. Sometimes just a glance is enough.
It depends, therefore, on the depth that the trader wants to give to their investment activity, as well as the approach they adopt towards technical analysis. If their technical analysis is based on indicators that, for example, base the release of signals on the statistical study of volumes, supports/resistances derived from minimums are sufficient, since their approach does not include supports and resistances as the main course on the menu.
How to Calculate Pivot Points
Another difference between Pivot Points and "ex" minimum/maximum supports/resistances is the quantity. In fact, there are as many as six Pivot Points. It's good, therefore, to present them and explain how they are calculated. A small comforting note: no trader is forced to calculate them by hand; they are kindly offered by the platforms. However, it's always good to know how they are derived to understand their effectiveness.
Before transcribing the formulas, it's necessary to insert a small legend.
H = High Price.
L = Low Price.
C = Closing Price.
AP = Average Price, which in turn is calculated by dividing the sum of the high, low, and close by three.
Here are the formulas.
First Support S1 = (2 x AP) - H
First Resistance R1 = (2 x AP) - L
Second Support S2 = AP - (R1 - S1)
Second Resistance R2 = (AP - S1) + R1
Third Support S3 = S2 - (High - Low)
Third Resistance R3 = R2 + (High - Low).
How to Use Pivot Points
Pivot Points have various uses. Moreover, they vary based on the trading style, which can be fast, intraday, swing, and so on. However, two uses are good for all seasons and all approaches.
The first is of a "cognitive" type, if it can be called that. In this case, Pivot Points are used to discover what phase the market is in.
For example, if the price is between the first and second support, the market is congested and is probably moving sideways. The reason for this is simple: the first and second supports are usually very close.
Moreover, if the price breaks the second resistance or the second support, then it means that the market is trending. In the first case, we are facing an upward trend. In the second case, a downward trend.
The second use is of an operational type, as it allows the trader to understand when it is better to sell and when it is better to buy. Generally, it's good to open long positions when the first resistance is exceeded, or when the first support is exceeded. In the first case, the target will be the second resistance; in the second case, the target will be the average price (identified as AP).
It's good to open a short position in case of a break of the first support, if the objective is the second support, or in case of a break of the first resistance, if the objective is the average price (always AP).
Pivot Points are also used to identify the most suitable levels to act as Stop Loss and Take Profit. Generally, a good Stop Loss is placed at a support if the position is long, and at a resistance if the position is short. The opposite is true for take profit.
Pivot Points Based on Trading Styles
We talked about Stop Loss and Take Profit, but without clarifying the nature of the supports and resistances. First, second, third? In truth, it depends on the approach, the trading style. That is, the time horizon within which one operates. This is not surprising, considering that the first support and the first resistance are close, the second support and the second resistance are far, and the third support and the second resistance are very far.
In a nutshell, if the trader engages in intraday trading, or even scalping, they can only use the first support and the first resistance. Unless "external" events occur that can upset the market (but in this case, we enter the territory of fundamental analysis), it's really difficult to reach the second Pivot Points, starting from a price X. In reality, then, scalping deserves a separate discussion, since its dynamics are sui generis, but still: even in this case, Pivot Points can be used.
If the approach is more long-term, and we are talking about swing trading, then it's good to use the second support and the second resistance. If the position is kept open for a few weeks, or even a few months, it's possible that the price will exceed the first support - first resistance range, so it's good to circumscribe the trading to the second Pivot Points.


