How Forex Indicators Work: Beginner's Guide
June 18, 2018

Forex indicators are tools of fundamental importance for profitable trading. However, for the uninitiated, they may represent tools that are not easy and immediately understandable, since they require a certain level of competence to be exploited to the fullest and, above all, to be chosen effectively.
The landscape of Forex indicators is indeed extremely flourishing, and this, while increasing the possibilities of choice on one hand, on the other could cause a bit of disorientation. In this article, we will delve into the topic of "Forex indicators," offering an exhaustive definition and describing their mechanism.
What are Forex indicators
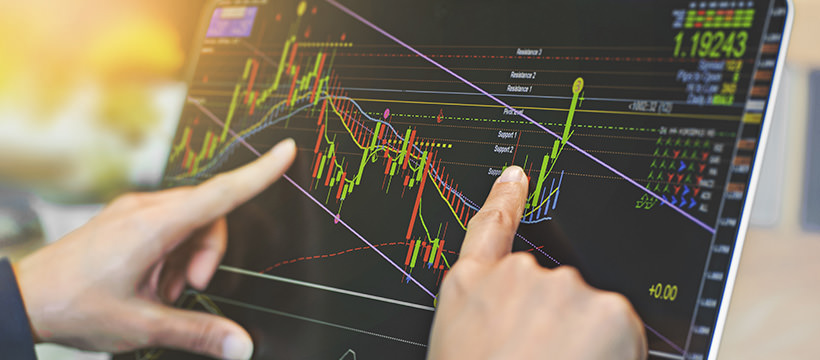
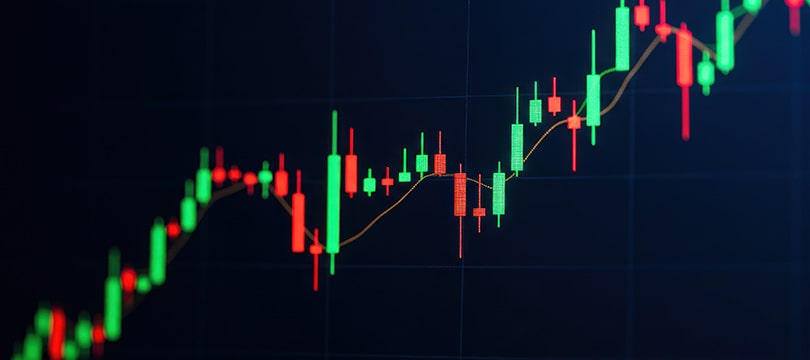
Indicators are tools that allow you to read the market and draw signals regarding the price. Through the use of indicators, and especially their interpretation, the trader can obtain estimates about the near (and less near) future of the asset they are trading. For example, the RSI indicator applied to the euro dollar allows the trader to understand if the exchange rate is in an upward trend, a downward trend, or if it is moving sideways.
Obviously, this is just an example. Numerous indicators are available to traders, each of which is specialized in offering a particular type of information.
How do indicators reveal information about the price? To answer this question, it is necessary to describe the mechanism.
Indicators, in reality, do nothing more than analyze the market from a "diachronic" point of view, that is, taking into consideration not only the current structure but also the past one. They operate with an overall view, which can extend even to periods much earlier than the present.
All indicators exploit a principle dear to technical analysis: history repeats itself. According to this principle, there is continuity and coherence between causes and effects. They reveal that event Y follows event X, and that there is a correlation between the two. These cause-effect relationships are crystallized in patterns and are used by indicators to launch signals.
Obviously, this is a partially arbitrary principle. We are talking about probability and not scientific certainty. For example, it is likely that exceeding a weekly high will be followed by a price increase, but it is not at all certain. This is also because numerous factors influence the price, some of which are completely random or in any case unpredictable.
For this reason, Forex indicators (like any other technical analysis indicator) should be used with reasoning and, above all, by taking certain precautions.
The first precaution consists in not believing the first signal that the indicator returns, but rather accompanying the reception of this signal with an interpretation work that is not necessarily technical, but based, for example, on the study of external factors, therefore on fundamental analysis.
A second precaution consists in using several indicators simultaneously, so that one can act as proof/counterproof with respect to the other. If two or more indicators generate the same signal, it is likely that it is real and can be functional for the elaboration of an order. Some indicators lend themselves to being used in pairs, precisely because the strengths of one correspond to the weaknesses of the other and vice versa, in a perspective of complementarity that is certainly good if the goal is to reduce the margin of error. The most famous "pair of indicators" is the RSI-Stochastic.
The best possible combination is that between trend indicators and volume indicators. The former, in fact, provides information on the direction of the price, while the latter provides indications on the strength of the negotiations. To fully understand this statement, however, it is necessary to distinguish between the various types of indicators.
The types of indicators
Trend indicators. These indicators reveal whether, in reality, the asset is in an upward or downward trend. This is necessary information but not always clear. In fact, in some situations the market seems to move sideways even when it is in a trend - albeit a weak one - ascending or descending. The following indicators belong to this category: ADX, EMA and SMA (moving averages), MACD, Parabolic SAR.
Cycle indicators. The cycle can be defined as the category immediately above that of the trend. A cycle is made up of several trends and is characterized by a certain temporal amplitude as well as a certain regularity. Cycles, in fact, repeat themselves. Understanding in which cycle the asset is and, above all, in which part of the cycle is fundamental for positioning winning trades. Cycle indicators are the most difficult to interpret precisely because of the amount of information they carry within them. The best known among those belonging to the category is known as "Elliott Waves."
Momentum indicators. The term momentum indicates the speed at which prices move given a reference period. It is also a useful element in understanding whether the trend is solid or not.
Volume indicators. These indicators reveal the strength of the market, i.e., the interest of investors. This translates into an increase in volumes. Volume analysis reinforces trend analysis. If an upward trend is associated, for example, with a growth in volumes, it means that the trend is destined to last. The most famous volume indicator is represented by the so-called acceleration bands.
Volatility indicators. Very simply, these indicators offer information about price volatility. Their limit is that they do not consider (as is obvious) external stimuli, such as those deriving from economic news. In any case, in situations that are not very eventful from a media point of view, they are very useful, especially in suggesting when it is not the time to enter the market. The most famous volatility indicators are the ATR and the Bollinger Bands.


