How to Get Dynamic Support and Resistance Levels
January 16, 2020
Dynamic Supports and Resistances are very useful technical analysis tools. They represent an opportunity to transform trading into a truly profitable activity. They allow traders to draw signals of continuation or more often reversal before these events actually occur. This provides a significant advantage, as it allows selling when the price is still high, or at least before it drops, or buying when the price is still low, or at least before it rises.
In this article, we provide an overview of dynamic supports and resistances. Later, we will offer specific guidelines on how to use these tools and how to obtain them in the quickest and most efficient way possible.
What Are Supports and Resistances Used For?
Supports and resistances are also defined as pivot points, an expression that testifies to their importance from a technical analysis perspective.
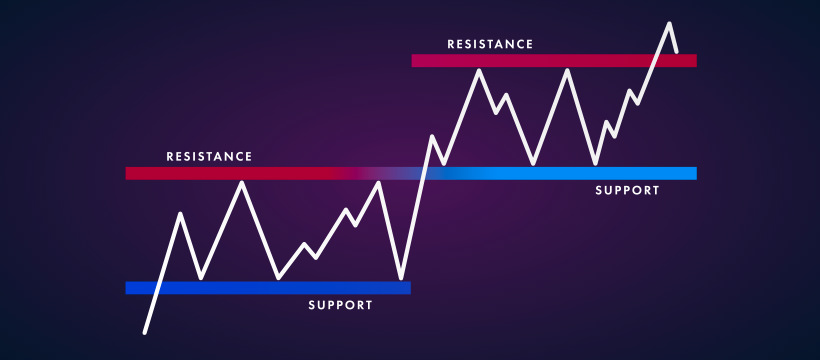
Specifically, support is the price below which an asset, however in a downward trend, struggles to fall. Conversely, resistance is the price above which an asset in an upward trend struggles to rise.
How are supports and resistances used? Obviously, it is necessary to analyze the way in which the price interacts with these two particular prices.
Let's start with support, imagining an asset in a downward trend. When the price breaks through the support, i.e., it exceeds it and continues to fall, a sell signal is drawn as the downward trend finds a fairly significant confirmation.
The opposite is true if the price bounces, i.e., it touches or grazes the support and then rises. In this case, the signal is a reversal, meaning the asset should soon enter a true upward trend.
To understand the function of resistance in an analytical key, we must instead imagine an asset in a trend. When the price breaks through the resistance, i.e., it exceeds it and continues to increase, the signal is to buy. The upward trend is, in fact, confirmed.
If, on the other hand, the price bounces, i.e., it touches the resistance or only grazes it, and then turns around, even if only for a session, then a reversal signal is drawn. It is likely that the upward trend is about to turn into a downward trend.
What Are Dynamic Supports and Resistances?
"Normal" supports and resistances are easy to identify. Generally, the lows and highs, which can be daily in the case of a fast trend, weekly or monthly or yearly in all other cases, are set as reference points. Obviously, the lows act as supports while the highs act as resistances.
However, this method has a problem. It produces, in fact, static supports and resistances, which are not very responsive to the evolution that the market undergoes as sessions follow one another. The risk, therefore, is that they may prove ineffective or, worse, return false signals.
This is where dynamic resistances and supports come into play. That is, supports and resistances that follow the evolution of the market and provide "constantly updated" market understanding tools, or rather, in continuous movement.
This is a significant advantage, also because once identified, it is not necessary to repeat the operation at each session. It is no coincidence that in the vast majority of cases, dynamic resistances and supports are represented by regular lines.
Below we list some methods for identifying dynamic supports and resistances.
The Moving Averages Method
It is the simplest method of all, also because it uses one of the most used tools, both by beginners and experienced traders: the moving average.
The moving average is a line whose points are formed by the averages that the price has recorded during a predetermined number of previous days or sessions. If it is formed by weighted averages, based on the importance of the individual days (which intensifies as one approaches the present), it is referred to as an exponential moving average.
The moving average can then be slow, if formed from a number of days or sessions greater than 26, medium or fast, if formed from a number of days or sessions less than 13.
How to identify dynamic supports and resistances from moving averages? It is quite simple. It is a matter of creating a long moving average and a "very" long moving average, generally they should be 26 and 50 periods respectively. The moving average that is positioned below the price acts as dynamic support, while the moving average that is positioned above the price acts as dynamic resistance.
The Trendline Method
The trendline method is also a fairly simple method for deriving reliable dynamic supports and resistances. A trendline is a straight line in which some of the points are formed by lows or highs. Obviously not all the points, because in this case it would mean that the price has made a linear, regular, and constant path, which is simply impossible.
In any case, when highs are used, the trendline indicates dynamic resistance. When lows are used instead, the trendline turns into dynamic support.
It must be said that the trendline method is not always reliable. In fact, an aspect needs to be evaluated, namely the quantity of highs or lows involved. In a nutshell, the more highs and lows involved, the greater the reliability of the trendlines as dynamic resistance or support.
The Bollinger Bands Method
This is a more refined and for this reason more reliable method for deriving dynamic resistances and supports. The Bollinger Bands indicator consists of a moving average and two lines, which are the result of the moving average itself to which a standard deviation of +2 and a standard deviation of -2 are respectively applied. In this way, four bands are formed, two internal and two external, which help to return signals when they interact with the price.
However, the graphical conformation of the Bollinger Bands can also be useful for deriving dynamic supports and resistances. Very simply, the line with the standard deviation -2 acts as dynamic support, while the line with the standard deviation at +2 acts as dynamic resistance. This is the most reliable method of all (among those listed in this article), as it involves the moving average, but also a balanced price range, such as the +2/-2 interval.


