Here is the translated article in high-quality, SEO-friendly English with accurate financial terminology and preserved HTML formatting:
What are Pivot Points?
Pivot points are essential technical analysis tools for any trader who wants to invest with a clear understanding. Their identification and interpretation should be done regularly, and they serve as a perspective for a comprehensive understanding of the market.
In this article, we will discuss pivot points, aiming to provide a complete overview of the tool, some advice on interpretation, and, above all, reliable
indications for their correct identification.
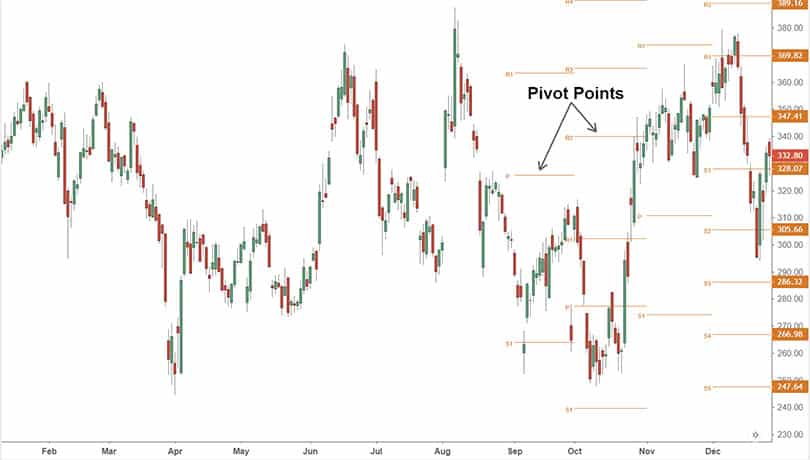
Pivot points are simply
price levels. In particular, price levels at which the asset struggles to continue its trend. They can be likened to both support and resistance levels and should be analyzed in the same way.
Pivot points are bearish, acting as support, when they are below the price. Pivot points are bullish, acting as resistance, when they are below the price.
When a price approaches a pivot point,
two events can occur. The more likely event is the price bouncing off the level; the less likely (but still more than possible) event is the continuation of the trend with the level being broken. In both cases, the trader can draw signals from these events and base their trading activity on them.
How to Use Pivot Points
Specifically, two types of signals can be drawn from the analysis of pivot points: trend reversal and trend continuation signals.
A reversal signal is obtained when the price reaches a pivot point and almost immediately retraces, even if briefly. Obviously, if the pivot point is bearish, the trend changes from descending to ascending; if the pivot point is bullish, the trend changes from ascending to descending.
Conversely,
a continuation signal is obtained when the asset not only reaches the pivot point but also surpasses it. The signal is strong as the trend has proven to be so solid that it managed to overcome a pivot point.
Pivot Points and Highs & Lows
The simplest method to identify pivot points is to calculate, or simply identify, the highs and lows. Basically, both highs and lows are special price levels that are difficult for all assets to surpass. Obviously, highs will act as bullish pivot points with resistance function, while lows will act as bearish pivot points with support function.
Which highs and lows should be used? After all, there are many: session, weekly, monthly, yearly, etc. The advice is to consider them all but to give more weight to those that best suit your time horizon.
Pivot Points and Moving Averages
Another method, which is much more interesting, is that of moving averages. That's right, moving averages can act as pivot points. Specifically, as dynamic pivot points, inserted within lines and able to follow the price, therefore always updated.
It involves creating and displaying two moving averages on the chart, one long and one very long. Generally, but it is not a fixed rule, one opts for a long moving average of 50 periods and a moving average of 26 periods. At this point, the moving average that moves below the price takes on the qualification of a pivot point level with a support function, while the moving average that moves above the price takes on the qualification of a pivot point with a resistance function.
The "dynamism" of this method is very convenient, as it increases the effectiveness of the signals.
Pivot Points and Indicators
A final method, complicated but perhaps more effective, consists of using certain indicators. The reference is to indicators that integrate moving averages within them, or elements that use moving averages as a basis. The most emblematic example is that of Bollinger Bands, which is formed by a moving average and two lines. The upper line is the moving average to which a standard deviation of +2 has been applied, while the lower line is the moving average subject to a standard deviation of -2.
The upper line takes on the qualification of a pivot point with a resistance function, while the lower line takes on the qualification of a pivot point with a support function.
This method is useful as it allows obtaining more classes of signals, namely those relating to the interaction of the price with the pivot points and those relating to the indicator itself.