Why Position Sizing?
Position sizing defines the amount of capital to allocate in each trade, limiting risk and improving portfolio management. Here are the main reasons to implement it correctly.
Risk Control
Defining an adequate position size reduces the impact of potential losses on the overall capital. Without proper position sizing, a single trade could compromise the entire portfolio, a phenomenon that is far from rare, especially among less experienced traders. For a closer look at the amount to risk per trade, see how much you should invest.
Adaptation to Market Conditions
Markets do not always present the same level of volatility. Proper management of position sizes allows for reducing risk during turbulent periods and optimizing gains when conditions are more favorable. This aspect is crucial for those who operate in the short term, where market turbulence is more frequent.
Maintaining Psychological Stability
Avoiding excessive exposure reduces the emotional stress associated with trading. A balanced position sizing helps to follow the strategy with greater discipline, without making impulsive decisions due to market fluctuations. Knowing that the exposure is already capped lets you approach each trade with a clearer head.
ATR as a Solution for Volatile Markets
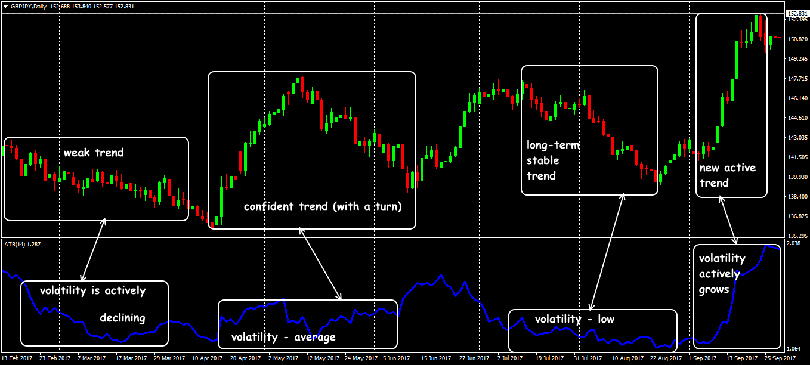
Determining position sizing in volatile markets is particularly complex. Wide price swings can make a fixed stop distance useless, raising the risk of being stopped out before the idea has had a chance to work. The ATR is the standard tool for that problem. For a broader look at structuring that stop distance, see where to place a stop loss.
The Average True Range (ATR) measures the average volatility of an asset over a given period. Created by J. Welles Wilder, the ATR does not indicate the direction of the market, but provides an indication of its variability.
A high value signals greater volatility, while a low value suggests a phase of stability. By using ATR, it is possible to adapt the position size according to market conditions. The Volatility page on this site publishes the 14-period ATR of every pair on hourly, four-hour and daily bars, with the percentile that says how the current reading compares with the last month: the stop multiple and the size described below can be read straight off it.
How to Use ATR
ATR is applied in position sizing to establish an optimal stop loss distance and to determine the amount of capital to allocate in each trade. Its use involves the following steps.
- Calculation of ATR. Most trading platforms provide ATR as a default indicator. The value is calculated by considering the average of the True Ranges of the last periods (generally 14).
- Definition of Stop Loss. A common methodology consists of setting the stop loss based on a multiple of the ATR. For example, using a value equal to 2 times the ATR, the stop is positioned at a distance that takes into account the typical market oscillations.
- Adaptation of Position Size. To determine the quantity of assets to buy or sell, the following formula can be applied:
Position size = (Capital at risk per trade) / (ATR x risk coefficient)
The capital at risk represents the maximum amount that one is willing to lose in a single trade. Usually, it is calculated as a percentage of the total capital, for example 2% of the trading account.
The risk coefficient is a value that adjusts the stop loss distance with respect to the ATR, based on market volatility. It is calculated according to the risk strategy adopted: a lower coefficient reduces the stop loss distance, while a higher coefficient widens it, leaving more room for natural price swings before the position is closed. This sits within the broader discipline of money management; see risk control to boost profits.