Price Channel
A price channel is a particular chart pattern that emerges with a certain frequency. However, it is generally underutilized by traders, except at a basic level, not exactly strategic.
We discuss it here, providing an overview of the implications of price channels for trading activity and offering some advice on how to exploit it properly.
A Definition of Price Channel
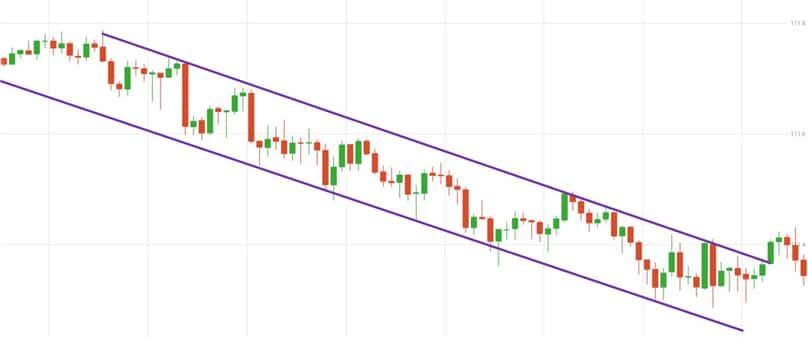
Just take a look at the image on this page to understand what a price channel is. In essence, a price channel is defined as that chart pattern that emerges when prices move within a "mobile" range, which rises upwards or downwards. In short, when the price channel is active, it can happen that:
- Both highs and lows are consistently higher
- Both highs and lows are consistently lower
Another characteristic of price channels is that the distance between highs and lows tends to remain the same. Obviously, this is an ideal scenario. In reality, distances are a bit more variable, while the speed at which highs and lows move is never entirely regular.
It's very simple to notice the appearance of a price channel. In some cases, when it is quite regular and similar to its ideal version,
just a glance is enough. Generally, one notices it when drawing support and resistance lines. After all, one way to draw them involves using more or less recent highs and lows.
How to Exploit the Price Channel
What meaning should be given to the price channel? How to use it for strategic and operational purposes? First, it is necessary to understand or at least estimate its strength. Some channels last for days, others for weeks, and others even for months (although they are quite rare).
When the price channel is solid, the channel can be used as a reliable tool
for plotting resistance/support levels. For example, one could sell upon reaching a resistance level or buy upon reaching a support level, precisely because the channel gives prices a minimum of predictability. From this perspective, the projections of the lines that enclose the channel make a big difference.
It is also worth mentioning a small trick, that is, an alternative way to read the channel, especially when it shows signs of regularity. As reported by Traderpedia (an informational portal of Trader Link), it may happen that a low or a high fails to reach its potential given by the range, i.e., it stops before the previously projected channel line.
In this case, the subsequent high (if the problem involves the low) or the subsequent low (if the problem involves the high) will slightly exceed the line. Being aware of this dynamic means being able to gain valuable pips and act with even greater timing.
A Focus on Chart Analysis
The study and use of channels for descriptive, strategic, and operational purposes are inextricably linked to
chart analysis. Many confuse chart analysis with technical analysis, since the latter has the chart as its "workbench." In reality, chart analysis is simply a branch of technical analysis.
Specifically, it studies, for strategic and operational use,
the patterns that form on the chart. The patterns, being an expression of price movement, are often significant, i.e., they provide information about the present and some resources to estimate what will happen in the future.
Obviously, chart analysis can only be performed if a certain type of chart is used, the candlestick chart. It is the one that provides the most information and makes the formation of patterns possible.
The advice, as usual, is to
not focus on just one discipline. Chart analysis alone can do little, as can technical analysis in the strict sense. The same goes for fundamental analysis. The goal should be to receive reliable signals on which to base one's moves. The best approach, therefore, is to make these disciplines coexist, so that one provides a countercheck to the signals of the other.