Support and Resistance: Definition, Purpose, and Calculation
June 11, 2019
Support and resistance are two elements, or two types of elements, that play a leading role in the trading activities of beginners and experts alike. If used with caution and intelligence, they truly allow traders to gather information to move effectively in the markets, and consequently increase their chances of profit.
In the following article, we will dedicate considerable space to support and resistance, offering an exhaustive but understandable definition and providing precise indications on the correct ways to use them. Finally, we will offer advice that is not at all obvious, and therefore often disregarded.
Support and resistance: definition and uses
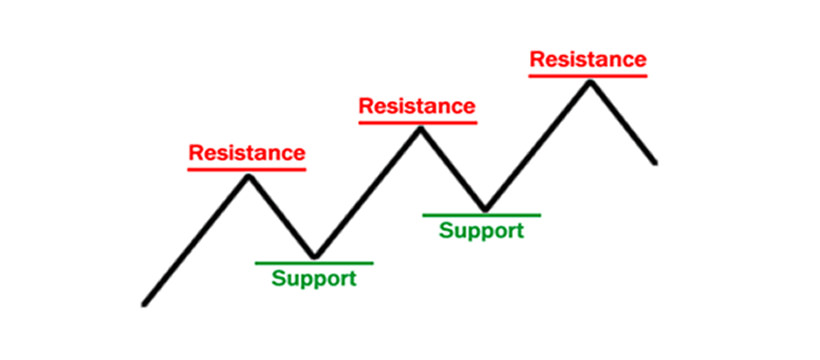
Support and resistance are also called pivot points. In fact, they are very particular price levels that serve as a sort of orientation for traders. Specifically, however, they are price levels at which the asset struggles to perform certain actions.
Support, in particular, is the price level below which the asset struggles to fall.
Resistance, on the other hand, is the price level above which the asset struggles to rise.
They can be considered "invisible" barriers, beyond which the market proceeds with a certain difficulty.
To be clear, support and resistance are not insurmountable, far from it. This often happens, and in fact, their crossing produces precise signals and information.
What kind of signals? The interaction between the price and the support/resistance levels offers information about future price movements.
If the asset in an uptrend bounces off the resistance, and especially if it does so for many consecutive times, it is likely that a trend reversal will occur. If the same asset, still in an uptrend, breaks through the resistance and continues its march, this is generally seen as a signal of trend continuation, which thus gains further strength.
The same discourse, but specular, applies to support. If the asset in a downtrend bounces off the support, especially for several consecutive times, then a trend reversal that is anything but temporary could be near. If the same asset, still in a downtrend, breaks through the support, this is considered a signal of trend confirmation.
To understand the nature of support and resistance, two clarifications must be made.
There is not just one support and one resistance. In reality, as we will see in the next paragraph, there are many price levels that can act as support and resistance. The issue is not objective but changes form and modality based on contingencies, the needs of the trader, and above all, the time horizon of the trading activity. We will explore these dynamics later, but for now, suffice it to know that a day trader calculates support and resistance in a completely different way than a swing trader generally does. Moreover, it also depends on the trading style, the ability (and willingness) to use complex tools, etc.
There are static and dynamic support/resistance levels. This is one of the pieces of information that needs to be internalized and assimilated more quickly, also because the two variants of pivot points give rise to differences in terms of practical application and ways of receiving signals. A support or resistance corresponding to a well-defined and immutable price point is defined as static support or resistance. A line formed by support and resistance that changes as the price varies is defined as dynamic support and resistance. In short, dynamic support and resistance accompany the asset, almost providing a permanent ceiling and floor.
4 methods to find support and resistance
As already mentioned, support and resistance do not paint an objective picture. This is true for their applications, of course, but also for the methods of identification. On the other hand, there are several methods to identify support and resistance, some more valid than others, some more suitable to respond to a specific type of trading. In any case, here are the methods in question, listed in order of complexity.
The psychological threshold method
Identifying psychological thresholds is a good method for establishing support and resistance. The reason is quite intuitive. If it is true that support and resistance generate a certain arrest or at least a deceleration of the trend, but once surpassed, they impart speed, the same dynamic can be assigned to psychological thresholds.
These, in theory, are arbitrary. That is, they correspond to graphical or numerical peculiarities. For example, speaking of the euro-dollar, 1.00 would be a truly relevant psychological threshold and could be considered a very strong support level.
Is the psychological threshold method effective? From a certain point of view, yes. Psychological thresholds are truly support and resistance levels to be taken into consideration. However, it is unthinkable to trade using only this method, also because prices are generally far from psychological thresholds.
The method of lows and highs
Among the so-called "technical" methods, it is the simplest to implement. Very simply, the lows are analyzed and elevated to support, the highs are analyzed and elevated to resistance. The reason is also intuitive in this case: both lows and highs are levels that are overcome with difficulty, as they are considered "important" by investors, so they can act as support and resistance.
The method of lows and highs is employed by the so-called minimalists of technical analysis, that is, by those who consider simplicity as a value to be pursued even in trading, thus rejecting a massive use (which, it is true, often degenerates into abuse) of indicators and oscillators.
Of course, it is a method that exposes one to many risks. For example, that of choosing the wrong lows and highs. Indeed, they abound on the chart. There are session, weekly, monthly lows and highs, etc.
The advice is to adapt the choice of highs and lows to one's time horizon.
The graphical analysis method
This is a very particular method. Very simply, specific parts of certain patterns of graphical analysis are elevated to support and resistance.
Let's take the Rectangle, for example. This figure indicates a consolidation of the lateral phase or a continuation of a previous trend. However, it automatically forms a very precise resistance as it is composed of highs that repeat more or less identically. The same happens with the lows, which form an equally defined support. In this case, it was the figure that clearly indicated support and resistance. This, to tell the truth, happens with a good part of the figures, regardless of their type (consolidation, continuation, reversal).
The biggest flaw of this method is that it is not replicable on command. In fact, it can only be used when a figure is activated. Moreover, they generally have a very short life cycle. The Rectangle, for example, sooner or later "disappears" to give life to a trend.
The moving average method
It is the most technical method of all. Moreover, it has several variants. The simplest one consists of setting two moving averages of different speeds (a very slow one and a very fast one). The moving average that is above the price will take on the appearance of a dynamic resistance, while the moving average that is below the price will act as a dynamic support.
The second variant consists of the use of indicators based, precisely, on moving averages. Some of them, such as Bollinger Bands, apply a standard deviation to the moving averages, such that they can always station above and below the price. In this case, the levels of dynamic resistance and support are more stable and can boast greater significance.
Two tips regarding support and resistance
The issue of signals has been more or less clarified. When one of the pivot points is surpassed, the signal drawn from it is a confirmation of the current trend. When one of the pivot points is the architect of a bounce, the signal drawn from it, at least at a hypothetical level, is a trend reversal. This, of course, is not enough to be able to fully exploit support and resistance. In this regard, it is good to offer two very useful and simple indications to follow.
Do not use only one method of identification. The methods, as we have seen, differ in degree of complexity and basic mechanisms. There is not one that is better than the other. Certainly, there is not one that can boast exclusive autonomy. The advice, therefore, is to identify (with different methods) multiple support and resistance levels. In that way, it is possible to verify the signal by means of several pivot points.
Do not use support and resistance exclusively. Sure, they are very useful elements, resources for receiving signals. However, the market is too complex an entity to be tamed only through pivot points. The advice, therefore, is to associate the identification and study of support and resistance with other indicators and oscillators, perhaps able to read volumes with effectiveness and simplicity.


