Technical analysis is a fundamental practice for trading with knowledge and understanding of the market as a whole, and, as much as possible, predicting future prices. There are numerous technical analysis tools that, when used with care, can provide a complete overview of the market and serve as a guide for traders.
However, one of the mistakes that many beginners make is using these tools "alone",
without combining them with each other. This is a bad habit, perhaps due to lack of experience, but it can have a devastating impact on profit hopes.
In this article, we address the issue by providing some advice on combining three of the main elements of any technical analysis worth its salt: support, resistance, and indicators.
The importance of technical analysis
We mentioned technical analysis in the introduction, defining it as fundamental. And indeed it is. Without technical analysis,
trading becomes a gamble, and leads to a degeneration, namely the approach of the gambler. This approach, which inexperienced beginners sometimes adopt, represents the quickest and unfortunately most effective way to lose one's capital. Technical analysis means studying the market in order to understand it, but also to derive signals to use as a source of guidance for investing.
Technical analysis is not an absolute science. It does not provide solid guarantees, even if practiced perfectly. It is not a matter of certainties but of probabilities. We are in fact in the field of
statistics, as demonstrated, among other things, by the structure of most of the tools that allow technical analysis to be practiced.
Technical analysis is based on a few solid principles. Firstly, everything important for trading purposes
is discounted in the prices. This is a way of stating that "studying prices", and therefore very simply the chart, is sufficient for trading. The second key principle is that "
history repeats itself", meaning that with certain stimuli, the market is likely to react in the same way. Hence the approach historically used to create
indicators, which generate signals based on a schematization. In short, when doing technical analysis, looking at the past means being able to understand the future ahead of time.
Of course, not all traders consider technical analysis as a self-sufficient discipline, in total homage to the first principle. In fact, the practice of fundamental analysis is widespread, which is another method of understanding the market and receiving signals. The object of study is the environment external to trading, all the events that, again according to a statistical modeling, impact prices. Ideally, both should be used, perhaps as a double check, giving both technical analysis and fundamental analysis the same degree of dignity.
In this article, however, we limit ourselves to talking about technical analysis, and in particular the combination of some specific tools, namely
resistance, support and volume indicators. Combining, in this case, means increasing the probability of reaching a profit, starting from a more accurate understanding of the market and the reception of reliable signals.
Support and resistance: what they are and how to use them
Support and resistance are well known to traders. They are tools that respond to an almost innate need of investors, that is to understand where an asset can go in good and bad times. They are also technical analysis tools in their own right, which can be responsible for receiving more or less reliable signals. Their use, moreover, is not even complicated, to the point that they represent the daily bread not only for experts but also for beginners.
Obviously
we are not dealing with perfect tools, with guaranteed effectiveness, also because this qualification cannot be attributed to anything concerning trading. However, there are techniques that allow reducing the margin of error, albeit complicating (and not a little) the analysis path.
Before launching into advice in this regard, it is necessary to answer the question: what are support and resistance? Well, they are "simply"
price levels. That is, price levels that, once reached, cause a slowdown or a block by the asset, at least in most cases. If, for example, an asset reaches a price level identifiable as a support,
the asset tends to bounce. Obviously, it is possible that an asset ignores the price level in question or exceeds it, but even in this case we are dealing with a significant event, which must be used to derive a signal.
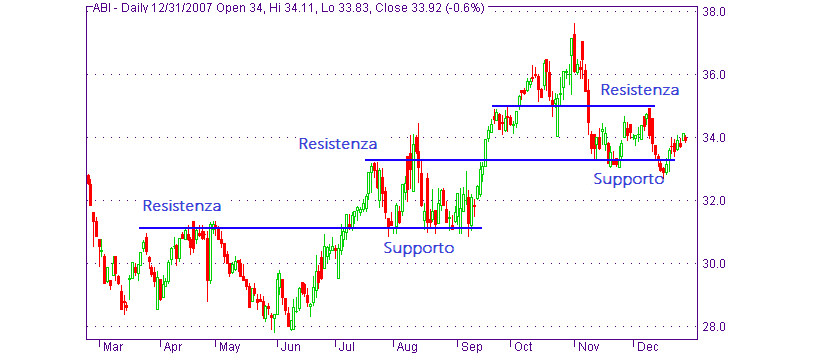
Specifically, support acts as a block or collection point in the case of a downward trend, while resistance acts as a block or collection point in the case of an upward trend.
How can support and resistance be used for trading purposes? The basic principle is quite intuitive: we analyze
the possible interactions between these price levels and the asset. The most important signals that can be derived from support and resistance are two: continuation signals and reversal signals.
Continuation signals suggest that the trend is likely to continue its run, and indeed strengthen, in the short term at least.
Reversal signals, on the other hand, suggest that the market is ready for a turnaround, i.e. the transition from a downward trend to an upward trend, or from an upward trend to a downward trend.
So...
A continuation signal is obtained when the asset in an upward trend reaches a support and exceeds it, or when the asset in a downward trend does the same with the resistance.
On the other hand,
a reversal signal is obtained when the asset in an upward trend does reach the support, but then retraces more or less visibly; or when the asset in a downward trend performs the same (but specular) movement with the resistance.
The massive use of support and resistance poses two orders of problems. The first concerns
its identification. In fact, there is not just one support and one resistance, there are countless ones. First of all because they can be traced according to various and complex methods. Secondly, because
there are as many support and resistance levels as there are time horizons to adopt. Let's give an example: support and resistance can be traced by identifying lows and highs. Lows become support and highs become resistance. However, there are various highs and lows: daily, weekly, monthly, etc.
Another problem related to the use of support and resistance is that...
Alone they are not enough. They provide information that, while reliable, often turns out to be partial. This is the thesis we introduced at the beginning: using technical analysis tools as if they were self-sufficient is a bad idea, precisely because they are not self-sufficient at all. Here, then,
it is necessary to integrate the fundamental use of support and resistance with other tools, which can somehow solve the gaps they suffer from at a structural level. Nothing particularly complicated, just laborious. It must also be specified that not even in this way is it possible to obtain absolute guarantees, also because this concept is not part of trading.
The limits of support and resistance
The main limitation of support and resistance is that, in the end, they say nothing, absolutely nothing about an element that heavily affects the market, and that can be used to predict the movements of assets - at least - in the short term: volumes. That is, the amount of traffic generated by the asset at a given time. Thanks to these elements it is possible to identify the
moments of indecision of the market, generally a harbinger of trend reversals that are also quite marked.
For this reason, support and resistance, however well identified (consistent with one's time horizon), can never be one hundred percent reliable.
Combining support and resistance and indicators: some examples
How to solve this problem? We mentioned it in the previous paragraphs. It is sufficient to combine the analysis of support and resistance with the analysis carried out using other indicators. Specifically, indicators that have their own "core business" precisely in volumes. Among these, the
RSI, the Relative Strength Index, an indicator widely used by beginners and experts alike, stands out.
The RSI returns values starting from the analysis of volumes. The values range from 1 to 100. When the RSI returns values below 30 we are facing an oversold situation, when the RSI returns values above 70, we are facing an overbought situation.
Now, both overbought and oversold indicate a market in "exhaustion" and therefore suggest a reversal of the trend.
What does this have to do with support and resistance? Simple: a reversal signal collected through a support is
truly valid only if accompanied by an oversold signal collected through RSI. Similarly, a reversal signal collected through resistance is more reliable if accompanied by an overbought signal also collected through RSI.