Technical Analysis of Financial Markets: 5 Winning Strategies
June 21, 2019

Technical analysis of financial markets is a fundamental tool for traders of all levels. Its purpose is to study the market in order to acquire information about price trends, intuiting the trend and its strength, and intercepting any reversals in a timely manner.
It's a useful tool, certainly, but also an object of continuous elaboration, which translates into an offering of techniques and strategies that is extremely complex. This is also because there isn't just one method of analysis. Rather, these methods adapt to the various objectives that a trader can establish and even to trading style. In any case, there are techniques, methods, and strategies that are more widespread than others.
In this article, we present five of them. A clarification: they are not mutually exclusive. In fact, if possible, try to use them all together. These are approaches of pure common sense, whose effectiveness is also demonstrated by traders' experience.
The path of simplicity
Technical analysis of financial markets, and in particular that of Forex, is carried out through the use of certain tools. These are called indicators. Indicators constitute the crystallization of statistical models capable of reading the market in a different way than can be done with the naked eye. The underlying rationale is to trace "specific" conditions, which act as clues for confirming a trend, its reversal, the beginning of a lateral phase, etc. Generally, they are integrated into the platform, or provided by brokers. Fortunately, the trader doesn't have to calculate anything, but only set up and read.
Now, there are various indicators. All are endowed with a certain effectiveness. Therefore, the first instinct is to use as many as possible. After all, if it's true that two heads think better than one, it must also be true that multiple indicators work better than just one indicator. However, the truth is quite different. Certainly, using a single indicator is very limiting, and leads to high probabilities of defeat. However, the opposite extreme also embodies an approach to be absolutely avoided.
Using many indicators simultaneously is dangerous. Firstly, because it increases the probability of encountering false signals. Secondly, because conflicting signals will be acquired, which further confuse the trader's ideas. Finally, there is another consequence to consider: using many indicators at the same time takes up a lot of time. Time that, obviously, could be spent on a leaner analysis or simply on planning orders.
Therefore, choose the path of simplicity. A couple of indicators are enough for you to effectively analyze the market. Obviously, it all depends on how they are chosen and how they are used.
This is a rule of common sense, but one that is often disregarded by inexperienced traders. The reason is simple: the use of many indicators, at least initially, restores a sense of control. In a certain sense, the path of complexity is more of a fetish than a real possibility. Specifically, a fetish that allows you to keep anxiety under control. However, it's only a feeling, which often presents the bill in terms of trading effectiveness.
The integration between multiple indicators
This approach is closely linked to the previous one. We said that using many indicators is harmful, because it confuses, generates conflicting signals, and takes up too much time. However, this should not lead to an approach aimed at excessive savings. Indicators are important in a trader's life, and they are when used at least in pairs. Obviously, you need to know how to choose them, to match them in a certain sense. In this way, you can lay the foundations for a good technical analysis of financial markets, intuit the price trend with a narrow margin of error, and trade accordingly.
The rationale behind the discussion of matching is easily intuitable. It's the principle of counterevidence. Those who do technical analysis know for certain that the risk of encountering false signals is always high. An eventuality that is far from rare yet catastrophic, capable of literally leading astray. So, what to do? Simple, adopt the principle of counterevidence. One indicator, almost structurally, should act as a counterevidence to another, in order to verify the accuracy of signals and avoid the risk of false signals.
Therefore, choose indicators in this perspective. For example, the MACD and RSI pair should be considered. The first is a price indicator, which provides signals by analyzing the interactions between multiple moving averages. The second is instead a strength indicator. In this way, one tool somehow refutes or confirms the other, and together they ensure a certain reliability. Obviously this is just an example, the combinations are numerous. As a price indicator, Bollinger Bands could be used, perhaps in combination with any momentum indicator.
Integrating technical analysis
This is an unpleasant truth: technical analysis of financial markets may not be enough. In fact, in many cases it is not enough. For example, when the market becomes volatile and essentially unpredictable not due to normal trading dynamics but because of what is happening outside. Not to mention the fact that, even if the market does not suffer from external upheavals, the context may be too complex to be read by just a couple of indicators. Therefore, something else may be necessary. Let's start with the discussion of the intrinsic insufficiency of indicators.
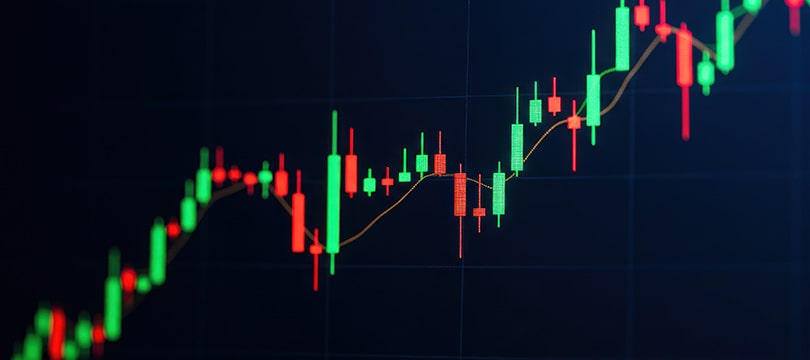
Often, an additional verification tool may be necessary. Or, to put it better, a tool that gives way to more complex analyses, which can therefore represent a first level of analysis, a first alarm bell. This tool is graphical analysis. Actually, it is a branch of technical analysis. The real big difference compared to the classic variant is that, in this case, indicators are not used but candles. Exactly, it is the candles of the graph that generate the signal. Specifically, when they form specific figures. They can suggest a confirmation of the trend, rather than its conversion or the beginning of a lateral passage.
Another tool to supplement technical analysis that cannot be missing is fundamental analysis. In this case, the paradigm changes completely. To generate signals is not the study of the market but the exact opposite: everything that happens outside the market. Indeed, many events are able to impact prices, and generally they always do so in the same way. Understanding, for example, what data will come out of an institutional meeting means intuiting the reaction of investors and, consequently, the price trend. Paradoxically, despite calculations, mathematics and statistics having little to do with it here, fundamental analysis is more complicated than technical analysis. Also because skills such as interpretation ability, foresight, and synthesis ability are necessary.
The importance of others' analyses
The trader, after all, is a lone man. It is he who personally manages his capital (except for special programs and services), it is he who decides how much and how to invest. Obviously, it is he who produces the analyses that will guide him in trading choices. However, this profession of solidarity presents some exceptions. In certain cases, the trader is called to step out of his shell and rely on others, especially when it comes to technical analysis. No, the reference is not to particular services such as copy trading, nor to participation in one or more communities. The reference is to the opportunity to study institutional analyses, i.e., the classic analysis papers.
Analysis papers are generally drafted by institutional bodies or, more often, by large commercial banks. By default, they are created for the use and consumption of clients. However, they are almost always made available to the general public, also because they can be used as a marketing tool. In any case, the trader has at his disposal the analyses carried out by a bank or a large broker of which he is not a client. Complex and also very useful analyses. Firstly, because they are carried out by professionals. Secondly, for the approaches with which they were developed.
What objectives does the study of others' papers allow to achieve? Certainly, they are published regularly but never in close succession. Generally, every three months. Therefore, if you are looking for an in-depth but short-term analysis, papers are not for you. However, they are incredibly useful for acquiring context notes, for having an exhaustive overview of the medium term. Many papers, in fact, produce estimates that develop over two or three years. Understanding the context, looking at the market by broadening the field, are fundamental steps for producing, perhaps autonomously, short-term analyses that are functional to the setting of even daily trades.
The usefulness of routine
This is more than a strategy, it is a real piece of advice. Also because it can be perfectly associated with what has been written so far. Routine, so to speak, goes well with everything. But what is meant by routine in trading, and specifically by routine of technical analysis? The meaning does not deviate from that which characterizes the collective imagination. It is a matter of doing the same things always in the same way, perhaps every day and at the same time. Routine can seem boring and also determine a feeling of rigidity. However, if well planned and better managed, it can represent the real turning point.
Why is routine effective? Answering is relatively simple: because the human being is essentially a creature of habit. Certainly, curiosity and the search for adrenaline are also part of his nature, but it is in routine that he finds a source of empowerment, an enhancement of his skills, a rapid and exponential improvement in performance. In any field, and therefore also in trading, routine means efficiency. In practice and repetition, almost always, lies the secret of success. It may seem a disappointing truth, while to others it will seem trivial and obvious, but it is still unquestionable.
How are routine and analysis linked, in a nutshell? First of all, it is necessary to dedicate always the same part of the day to analysis and, if possible, the same amount of time (which can also be hours, it is up to the trader to decide). Secondly, it is necessary to always use the same tools, and in the same way. Of course, all this must not at all translate into rigidity. The trader must be able to change, if necessary. Even to bend the routine and modify it, if the situation requires it. These are, however, emergency events, or the classic exceptions that confirm the rule. In general, the routine can be maintained as such, in fact... It must be. The hope of analyzing the market well and creating the conditions for a lasting and profitable trading activity also depend on it.


