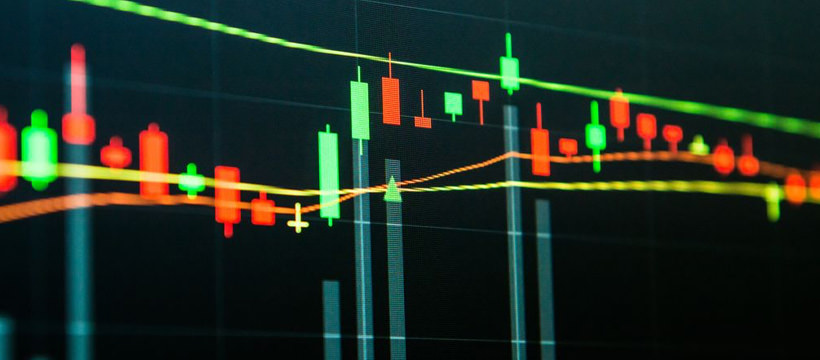
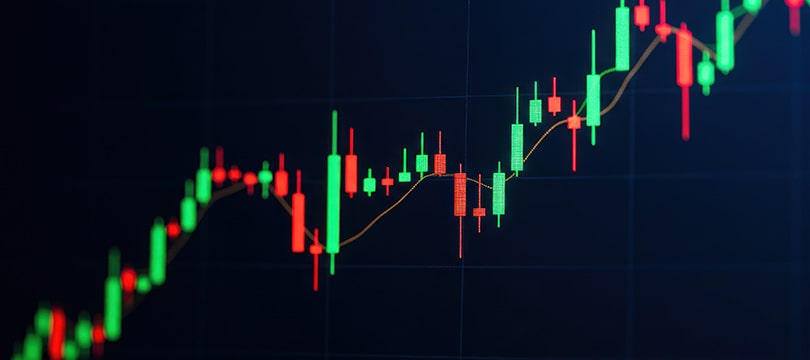
Technical analysis is a widespread practice, precisely because it is effective and, from some points of view, mandatory. The tools used to practice technical analysis are indicators. Especially beginners risk floundering around these two concepts. In fact, they are not intuitive at all.
In this article, we present technical analysis and indicators, first by describing how they work and then by listing the most common and useful ones.
Why technical analysis and why indicators
Technical analysis refers to the study of charts, prices, and asset trends in order to obtain useful information for trading. At first glance, it would seem like a practice whose purpose is to predict the price. If the goal is to simplify to an extreme, perhaps to introduce the concept, this latter definition may also be useful. However, if you want to be precise and unambiguous, one thing needs to be made clear:
technical analysis does not allow you to predict anything, at least not with certainty. At most, it offers information - also never one hundred percent certain, about the direction the price will take and its permanence in it.
It succeeds because it is based on a simple and effective mechanism. It takes into account that in the market "history repeats itself," and therefore it is possible to arrive at "behavioral" models. According to these models, given a particular event, another event will always follow, in a correspondence that is repeatedly reiterated.
What about indicators? These are simply analysis tools that, starting from these models, draw data from the market and measure certain evidence. Based on this evidence, the trader then derives signals that can be entry, exit, etc.
Now, there are a large number of indicators, each of which can be useful. It is therefore a good idea to make a selection of the most common and effective ones.
Moving Averages
The term moving average simply means
the average of prices recorded over a given period of time. It is called "moving" because it is calculated dynamically. Each point of the average, which appears on the chart as an irregular line, expresses the average of a certain number of previous periods.
Based on the number of periods taken into consideration, the average can be fast (few periods) or slow (many periods). A fast average is, obviously, less "graphically" regular than a slow average since price fluctuations have a greater weight.
The mechanism through which moving averages are used in technical analysis is very simple. The interaction between moving average and moving average, and between moving average and current price line, is studied. From these crossovers, signals are obtained.
If, for example, the price crosses a moving average from the bottom to the top, then this is a bullish signal. In this specific case, the slower the crossed moving average, the stronger the signal.
RSI
An acronym for Relative Strength Index, it is a very useful indicator as it provides reliable information about the strength of any current trend. Through calculations and formulas (which are unnecessary to go into detail here),
the RSI derives areas of oversold and overbought. The first is the area in which the price stays when demand is high, and is enclosed between the values 70 and 100. The second is the area in which the price enters when demand is low, and is enclosed between the values 0 and 30.
If the price is in the overbought area or is very close to it, the trend derives a bullish signal. If the price is in the oversold area or is approaching it, the signal is bearish.
Generally, the RSI is never used alone. However, as a complement to other indicators, it is truly effective. It is usually accompanied by the ADX, an indicator that takes into account elements that the RSI does not consider and can therefore serve as a counter-check.
ADX
The ADX (full name: Average Directional Index) is also an indicator whose function is to inform about the strength of the trend. In addition, however, it also clarifies aspects related to directionality and takes into consideration elements extraneous to many other indicators, such as highs and lows. Again, through complex calculations.
Graphically, then,
the ADX produces three lines: the ADX proper, the +DM and the -DM. They are read as if they were moving averages. Therefore, it is the crossovers (between them and with the price) that generate the price.
The ADX, just like the RSI, generates signals at a high rate, so statistically many of these are false. For this reason, it is used in conjunction with other indicators (the RSI, in fact, but also the MFI).
Pivot Points
The term pivot point refers to support and resistance levels. A support is a price level that, when exceeded (from top to bottom), suggests an even deeper price decline. A resistance is, conversely, a price level that, when exceeded (from bottom to top), suggests a price increase. In the first case, the downtrend is confirmed and reinforced. In the second case, the same happens, but for the uptrend.
How are support and resistance levels derived? The main methods are three: through pure technical analysis, i.e., the use of indicators; considering session (or weekly, or monthly, or yearly, etc.) highs and lows, identifying psychological thresholds. If the Euro Dollar is hovering around 1.15, a "psychological" support is certainly 1.10.
Support and resistance levels are very useful. Firstly because they are effective and reliable, secondly because they are easy to use. Moreover, they are versatile: they are often used to set Stop Losses and Take Profits.
Bollinger Bands
A radically different discourse for Bollinger Bands, an indicator that is based on a completely different mechanism, easier to read and therefore within the reach of beginners. The purpose of Bollinger Bands is to indicate price ranges beyond which an asset can be said to be "subject to extreme volatility." These ranges are drawn by three lines, one below the other. Technically, Bollinger Bands measure the standard deviation of prices, a very common parameter in statistics.
How are Bollinger Bands used? There are numerous ways, but two are notable. The first involves attributing to the bands the meaning of "dynamic resistance and support." The second is the extraction of bearish and bullish signals, which are derived each time the current price touches or exceeds the bands.
MACD
An acronym for Moving Average Convergence Divergence, it is an indicator that represents the evolution of the moving average concept. After all, the name itself suggests it (moving average means just that). The indicator appears as lines, which are nothing more than graphical representations of the difference between slow (generally 26 periods) and fast (generally 12 periods) moving averages.
The MACD provides entry and exit signals, confirmation or breakout through the usual crossover mechanism. Unfortunately, however, they generate
many signals, so the risk that some (or even more than some) are false is very present. For this reason, just like many indicators, it is not used alone. It is often used in conjunction with the RSI. However, it is sufficient to carry out any "technical" counter-check.
Momentum
It is one of the simplest indicators of all. It appears graphically as a line, where each single point corresponds to the difference, expressed in percentage terms, between the close of a candle and the close of the previous candle. From this definition alone, however, one can intuit the real crucial element of momentum: the choice of period. The length of the candles, in fact, depends on the length of the period, so the momentum, depending on this parameter, can undergo even significant changes.
With this particular exception, the use of momentum is very simple. The chart places a straight line that represents the entire momentum line in a median way. The intersections between the momentum and this straight line are the events responsible for transmitting the signal. If the intersection comes from the bottom to the top, the signal is bullish. If the intersection occurs from the top to the bottom, the signal is bearish.
What period should be set for the momentum? Obviously, there are many possible choices, but ten or fourteen periods are generally preferred.
Stochastic
It is a very complete indicator. It calculates the ratio between closing prices and highs/lows recorded within a given period. The raison d'être of the stochastic has its roots in an intuition of its creator, the legendary trader George Lane: in an uptrend, closing prices approach the highs; in a downtrend, closing prices are close to the lows.
The stochastic produces
three parameters.
- %K. It indicates a line resulting from the ratio between the previous close and a moving average of twelve or fourteen periods.
- %D. It is the simple moving average of %K.
- Axes. There are two and they are horizontal. The first delimits the overbought zones, the second delimits the oversold zones.
Parabolic SAR
An indicator resulting from a complex calculation, it appears as a dashed line that follows prices by positioning itself above or below them. When the Parabolic SAR is above prices, the trend is bearish. When the Parabolic SAR is below prices, the trend is bullish. It is used with two purposes: receiving signals (according to the method just described), identifying the Stop Loss. In fact, the Parabolic SAR can also be considered as a dynamic pivot point.
When you want to use the Parabolic SAR, you need to be careful about its settings. There are two parameters in particular that need to be set: the step and the maximum acceleration. The first must be set to 0.02. The second must be set to 0.2.
Alligator
It is graphically the most complicated alligator. Reading and interpreting it is difficult precisely because it "dirties" the chart with as many as three lines, all quite irregular (although, in general, they follow the price fairly closely).
Each of these lines is a moving average. Not just any moving average, but an SMMA (a kind of exponential moving average). The three moving averages are respectively at 13 periods with an offset of 8; at 8 periods with an offset of 5, at 5 periods with an offset of 6.
Reading the Alligator is very complex. Signals are communicated by the intersection between the various moving averages and the moving averages and the price. The use of this indicator is recommended only for very experienced traders, or at least those accustomed to the analysis and use of moving averages.


