Fibonacci Strategy: The 61.8% Level Millions of Traders Watch Simultaneously
January 26, 2026
EUR/USD is falling. From 1.1200 to 1.0800 in two weeks. A 3.57% decline. Then it starts climbing back. Where will the bounce stop? Open any trading platform, draw Fibonacci from the low (1.0800) to the previous high (1.1200), and look at the levels: 38.2% at 1.0953, 50% at 1.1000, 61.8% at 1.1047.
The price bounces to 1.1045. It stops exactly at the 61.8% level. Coincidence? No. Because at that moment, thousands of traders around the world are watching the same level. Some already have limit sell orders placed at 1.1047. Others are waiting for confirmation to go short. The price arrives, finds resistance, and drops. Fibonacci has "worked."
But the real question is: did it work because 1.61803398875 (the golden ratio) has mystical properties that govern financial markets? Or did it work because millions of people believe it works, and therefore act accordingly, creating a self-fulfilling prophecy?
This guide explains what Fibonacci is in trading, how retracements and extensions are calculated, why it is so popular, the critical role of automated algorithms that react instantaneously to Fibonacci levels, and above all why it works (spoiler: it's not magic — it's mass psychology amplified by technology).
Leonardo Fibonacci and the Sequence That Conquered Wall Street
Leonardo Pisano, known as Fibonacci, was an Italian mathematician of the 13th century. In 1202, he published Liber Abaci, introducing the Indo-Arabic numeral system to Europe along with a particular sequence of numbers that today bears his name.
The Fibonacci sequence:
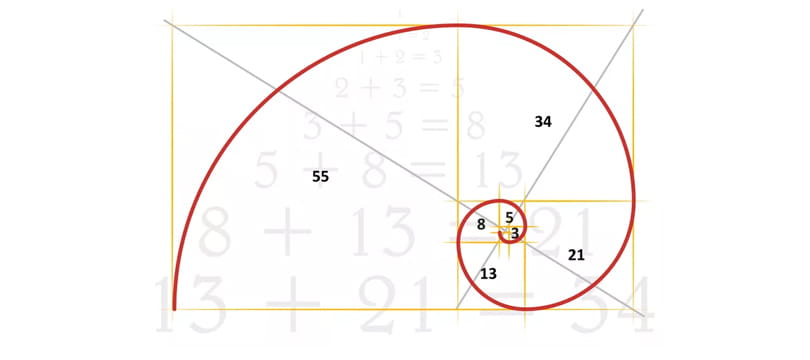
0, 1, 1, 2, 3, 5, 8, 13, 21, 34, 55, 89, 144, 233, 377, 610, 987, 1597...
Each number is the sum of the two preceding ones. Simple. But this sequence has fascinating mathematical properties. The ratio between consecutive numbers converges toward 1.618033988..., known as Phi (Φ), the Golden Ratio. This number appears everywhere: spiral shells, galaxies, human body proportions, architecture, art, and biology.
In trading, key levels are derived from Phi and its ratios. The 61.8% level is the reciprocal of Phi. The 38.2% level is obtained by subtracting 0.618 from 1. The 23.6% level derives from further calculations. These numbers form the retracements (below 100%) and extensions (above 100%) of Fibonacci used in trading.
Fibonacci Retracements: Where Does the Correction Stop?
Fibonacci retracements are horizontal levels that indicate where price might find support or resistance during a correction relative to the prior trend. The standard levels are 23.6%, 38.2%, 50%, 61.8%, and 78.6%. The 50% level is not technically a Fibonacci level but is universally used for psychological reasons.
Practical Bitcoin example. Low A: $60,000. High B: $73,000. Total move: $13,000. After peaking at $73,000, Bitcoin begins a correction. Retracement levels are calculated by subtracting the percentages from the high. The 61.8% level sits at $64,966. Price drops precisely to $64,900 and violently bounces from there, rallying back to $70,000. The 61.8% level held. Traders who had limit buy orders at $65,000 bought the correction's bottom.
Why that specific level? Because at that moment, thousands of traders around the world are watching the same level. Automated algorithms already have orders placed. The concentration of orders effectively creates support.
Fibonacci Extensions: Where Will the Breakout Reach?
Fibonacci extensions project levels beyond 100% of the initial move, used to identify profit targets when price exceeds the previous high. Standard levels are 127.2%, 138.2%, 161.8%, 200%, 261.8%, and 423.6%. The 161.8% level is the most important because it directly corresponds to the Golden Ratio.
S&P 500 example. Point A: 4,200. Point B: 4,800. Move: 600 points. Point C: 4,500 (50% retracement). Price breaks above the previous high of 4,800, continues rising, reaches 4,860 — very close to the 161.8% extension calculated at 4,871 — and stalls there for consolidation. Traders who had take-profit orders at 4,870 closed their long positions exactly at the top of the move.
Why Fibonacci Works: The Self-Fulfilling Prophecy
There is fierce debate over whether Fibonacci truly works. The truth is more nuanced: it works not because the golden ratio holds mystical powers, but because enough people believe it does.
The mechanism is clear. Millions of traders worldwide use Fibonacci. When price approaches the 61.8% level, many place orders. The concentration of orders around that level effectively creates support or resistance. Price reacts to the level, confirming that Fibonacci works. The more people believe, the more orders concentrate, and the more self-fulfilling it becomes.
Anecdotal evidence: open any trading forum when an asset makes a significant move. Dozens of people post screenshots with Fibonacci drawn on the chart. Everyone's levels are identical. And when price reaches the 61.8%, everyone notices simultaneously.
There is, however, a problem: if Fibonacci worked deterministically, it would be possible to build an algorithm that always wins. Many have tried. The reality is that Fibonacci works often enough to appear valid, but fails often enough to prevent it from being a guaranteed money-printing machine.
The Critical Role of Algorithms: Why Algos Amplify Fibonacci
This is the part that few people explain but is absolutely crucial: automated algorithms. In 2026, approximately 60–70% of volume in equity markets is generated by algorithms. In Forex, the percentage is even higher. In crypto, bots dominate.
These algorithms are programmed to recognize technical patterns, and many incorporate Fibonacci into their decision-making logic. The process is automatic: they continuously monitor all assets, automatically calculate Fibonacci levels when they identify a significant move, place limit orders at key levels, and if price arrives, the order is executed instantaneously.
The speed differential is staggering. A human takes 30–60 seconds to spot a move, draw Fibonacci, analyze the setup, and place an order. An algorithm does it all in 3 milliseconds. This means that when price approaches a Fibonacci level, algorithms react INSTANTANEOUSLY. If a thousand algorithms are configured to buy at the 61.8% level, all those buy orders fire within milliseconds. This creates volume spikes and price movement that appears as strong support.
The consequence: Fibonacci works best on liquid assets — major Forex pairs, leading indices, large-cap stocks — where algorithms dominate, and works less reliably on small-caps or illiquid assets where trading is more manual.
Controversy: some traders argue that automated Fibonacci trading does not work over the long term. One study tested hundreds of automated Fibonacci strategies and found that none consistently beat the market. The reason? Too many algorithms are doing the same thing, eroding the edge. It becomes an arms race where only the fastest and most sophisticated algorithms prevail.
Practical Strategies: How to Use Fibonacci Effectively
Fibonacci should never be used in isolation. It must be combined with other indicators for confirmation. First strategy: Fibonacci combined with RSI for entry timing. The setup involves an uptrend with price in correction. Draw Fibonacci on the impulsive move, wait for price to reach the 50% or 61.8% level, check that RSI is oversold or showing bullish divergence, and enter long when price bounces from the level with RSI confirming. Stop loss below the 78.6% level, target at the previous high.
Second strategy: Fibonacci combined with Volume Profile for confluence. Draw Fibonacci, overlay the Volume Profile to identify high-volume levels, and look for confluence where a Fibonacci level coincides with a High Volume Node. These zones have a higher probability of holding as support or resistance. The reason is that Volume Profile shows where the most trading has historically occurred. If a Fibonacci level aligns with a high-volume historical zone, it is a level defended by traders with open positions.
Third strategy: Multi-Timeframe Fibonacci for greater reliability. Draw Fibonacci across different timeframes and look for confluence. Use the daily chart for the major swing, 4H for the intermediate swing, and 1H for the minor swing. When levels from different timeframes overlap, the zone has an empirically observed 40% higher probability of holding.
Fatal Mistakes When Using Fibonacci
First mistake: drawing Fibonacci on swings that are too small. Drawing it on a 20-pip move on a 5-minute chart produces nothing but noise. Fibonacci works on significant swings — a minimum of 100–150 pips on Forex, at least 5% on equities, and at least 10% on crypto.
Second mistake: continuously redrawing Fibonacci. Price makes a new high, you redraw. It makes another high, you redraw again. This is curve fitting. Fibonacci should be drawn on a completed swing and left in place until a new significant cycle emerges.
Third mistake: expecting millimeter precision. Price will not touch the 61.8% level exactly. It may stop at 60.2% or 63.5%. Fibonacci indicates zones, not precise lines. Allow a buffer of 1–2% around the levels.
Fourth mistake: ignoring market context. Fibonacci during a strong trending market carries a different meaning than during a ranging market. In a strong trend, retracements tend to be shallow. In a weak trend, retracements frequently reach 78.6% or 100%.
Fifth mistake: using Fibonacci as the sole criterion. Fibonacci alone has a win rate of approximately 50% — essentially a coin flip. But combined with RSI, volume, moving averages, and price action, the win rate rises to 60–70%.
Fibonacci and Machine Learning: The Future
In 2026, machine learning algorithms are emerging that integrate Fibonacci in sophisticated ways. Rather than blindly following standard levels, these algorithms analyze thousands of historical cases to determine which level has the highest probability of holding in a specific context, adapt levels in real time based on current volatility, combine Fibonacci with hundreds of other factors such as social sentiment and order flow, and identify when Fibonacci is likely to fail and avoid those trades.
These AI systems do not believe in Fibonacci. They use it as a proxy to measure the collective behavior of human traders. It is a form of meta-analysis: if enough people use Fibonacci, that information can be exploited.
The paradox: as more trading becomes algorithmic, Fibonacci may become less effective, because too many algorithms are competing to exploit the same levels, creating competition that erodes the edge.
The Uncomfortable Truth: Fibonacci Is Not the Holy Grail
Some course vendors present Fibonacci as a magical system for predicting markets. The reality is more sobering. The win rate of pure Fibonacci without additional indicators is approximately 50–52%. With confirmation from RSI, volume, and other tools, it rises to 58–65%. Multi-timeframe analysis with sophisticated algorithms can push it to 65–70%. This means that even under the best conditions, 30–35% of Fibonacci trades will fail.
One controversial study tested hundreds of automated Fibonacci variations on S&P 500 intraday data. Result: no strategy outperformed buy-and-hold after commissions. The study's conclusion was that Fibonacci is pareidolia — seeing patterns where none exist.
Counterargument: that test was conducted on purely mechanical strategies. Fibonacci works better when used by a discretionary trader who integrates context, intuition, and other factors. Simple algorithms fail, but experienced traders applying Fibonacci with discretion can maintain an edge.
The truth probably lies somewhere in the middle. Fibonacci is neither magic nor useless. It is a tool that, used correctly in the appropriate context, provides a modest statistical edge — sufficient for a disciplined professional trader, but not enough for a beginner seeking quick wealth.
Conclusion: Fibonacci as the Common Language of Traders
Fibonacci does not work because the golden ratio governs markets. It works because it has become a shared common language among millions of traders. When everyone watches the same levels, those levels become relevant by definition.
It is similar to fiat currency: the dollar has value not because the piece of paper holds intrinsic properties, but because everyone agrees it does. Fibonacci holds power not for mystical reasons, but because enough people believe it does and act accordingly.
Algorithms amplify this effect. Instead of hundreds of human traders, there are thousands of bots reacting instantaneously to Fibonacci levels with orders worth millions of dollars. This creates real, observable, measurable price movement.
Using Fibonacci in 2026 means understanding this mechanism. It is not about believing in numerology. It is about recognizing that when enough market participants act based on the same information, that information becomes predictive — not through magic, but through emergent coordination.
The best approach: learn Fibonacci, combine it with other tools, test it on a demo account across hundreds of trades, and then decide whether it adds value to your strategy. For some it will work, for others it will not. But ignoring it entirely means ignoring one of the most widely used tools in global trading — and that is information that can prove costly.


