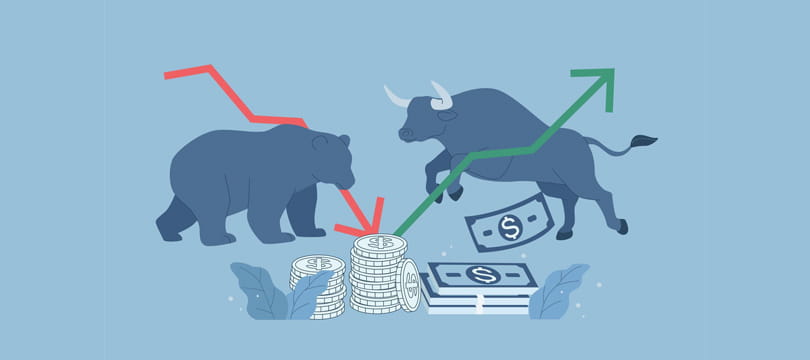
The 20% rule is a label rather than a signal. A market becomes a bull market when it has risen 20% from its low and a bear market when it has fallen 20% from its high, and in both cases the classification arrives long after the move that produced it.
The difference between a bull market vs bear market is, first of all, a label applied afterward. Knowing that is useful, because it explains why the phase you are in is never obvious at the time, and why almost everything written about how to trade each one is written with hindsight.
Bull market
A bull market is a sustained rise in prices, conventionally dated from a low once the index has gained 20% and running until it falls 20% from its subsequent peak.
The characteristics are consistent. Rising prices with broad participation across sectors. Improving corporate earnings. Expanding valuation multiples, as investors pay more for the same earnings. Rising volume on advances. Falling volatility. And a steady improvement in sentiment that eventually becomes the problem.
The stages are recognizable afterward. Early bulls climb what is described as a wall of worry: prices rise while most participants remain skeptical, because the previous decline is fresh. Mid-cycle brings confirmation as earnings catch up with prices. Late-cycle brings enthusiasm, expanding multiples, leverage, and the arrival of participants who were absent for the first two thirds.
Bear market
A bear market is the mirror: a fall of 20% or more from a high, with pessimism, weakening earnings and contracting valuations.
Two features distinguish it from a simple decline.
Speed. Bear markets fall considerably faster than bull markets rise. Fear acts more quickly than greed, and forced selling (margin calls, redemptions, risk limits) has no patience.
Rallies. Bear markets contain violent upward moves. A 10% or 15% rally inside a downtrend is normal, and each one produces confident declarations that the bottom is in. These are the most expensive moves in markets, because they arrive exactly when a trader wants to believe them.
A useful distinction is between a correction, a fall of 10% to 20% that is common, frequently annual and usually recovered within months, and a bear market. Most corrections are not bear markets, and the difference is only knowable afterward.
Where the animals come from
The most cited explanation is the way each animal attacks: a bull throws its horns upward, a bear swipes downward.
The documented origin is more interesting and less tidy. In eighteenth-century London, "bearskin jobbers" sold bearskins they did not yet own, hoping to buy them cheaper later: short sellers, in other words. The proverb about selling the bearskin before catching the bear was already current. The bull appears afterward as the natural opposite, helped by the popularity of bull and bear baiting as spectacles.
The short seller came first, and the optimist was named in response.
Recognizing the phase as it happens
Markets do not announce the transition. The 20% threshold is calculated retrospectively, and by the time it is crossed, a fifth of the move has already happened.
Some things carry more information than the price itself:
Breadth. How many stocks are participating. The simplest gauge is the share of index members trading above their 200-day moving average, published daily for the S&P 500. A rise driven by a handful of large companies while most decline is structurally weaker than a broad advance, whatever the index says. Deteriorating breadth has preceded most major tops.
The yield curve. An inverted curve (short-term yields above long-term) has preceded most recessions, with a lead time that varies from months to over a year. The version most watched is the spread between the two-year and the ten-year Treasury yield, the 2s10s. Useful as a warning, useless as a timing tool.
Credit spreads. The extra yield demanded on corporate debt over government debt; the high-yield option-adjusted spread is the series to follow. Credit markets are frequently earlier and more honest than equity markets, and widening spreads while equities make new highs is a disagreement worth noticing.
Sentiment extremes. Universal optimism is a late-bull condition and universal despair a late-bear one. This is contrarian reasoning, and it is right at the extremes and useless in between, which is the same limitation that applies to reading retail positioning in currencies.
None of these times a turn. Together they describe whether the current phase is early or late, which is a more answerable question.
The asymmetry in the record
The historical pattern in US equities since the Second World War is clear in direction even where the precise averages vary by source and methodology.
Bull markets last years and bear markets last months. The average bull has run several times longer than the average bear, and gains during bulls have been far larger in percentage terms than losses during bears.
This is why long-horizon investors are told to stay invested: the market spends most of its time rising, and missing the recovery costs more than sitting through the decline. Being out of the market for the best handful of days in a decade removes a large fraction of the total return, and those days cluster inside bear markets: in a widely cited J.P. Morgan study of the last twenty years, seven of the ten best days for the S&P 500 fell within two weeks of the ten worst.
The asymmetry does not mean bear markets are harmless. A 50% fall requires a 100% gain to recover, and the recovery is measured from the bottom rather than from where you were.
The episodes worth knowing
1929 to 1932. The Dow fell from 381 to 41, a decline of 89% over 34 months. It did not regain its 1929 level until 1954, twenty-five years later. This is the outlier that defines the tail of the distribution.
1982 to 2000. The S&P 500 rose from around 102 to over 1,500. Eighteen years of expansion driven by disinflation, falling rates and, at the end, the internet.
2000 to 2002. The dot-com unwind. The S&P fell about half; the Nasdaq fell 78% and did not recover its peak in nominal terms until 2015.
2007 to 2009. The financial crisis. The S&P fell from 1,565 to 677, roughly 57%, in seventeen months.
2009 to 2020. Eleven years, the longest bull market on record, ended by the pandemic in a matter of weeks.
February to March 2020. The fastest bear market ever recorded, a 34% fall in 33 days, followed by a recovery to new highs within months. Speed in both directions.
What actually changes between phases
Rather than a list of tactics, three things genuinely differ.
The cost of being wrong. In a bull market, a badly timed entry is usually rescued by the trend. In a bear market it is not, and the same mistake costs several times more. Position sizing should reflect the regime before it reflects the conviction.
What works. Trend-following and buying dips work in bulls and fail in bears, where each dip continues. Mean reversion and defensive positioning work in bears and underperform in bulls. A strategy that stopped working may not be broken; the regime may have changed underneath it.
Correlations. Diversification degrades in a bear market. Assets that behaved independently converge as everything is sold for liquidity, which is why a portfolio that looked diversified in calm conditions often is not when it matters.
The emotional cycle, which is the real subject
The reason most participants underperform in both phases is not analytical. The sequence is well documented and it repeats.
Early bull: skepticism, and no participation. The previous decline is too recent to trust the rise.
Mid bull: reluctant entry, driven by watching others make money.
Late bull: conviction and full commitment, at the highest valuations of the cycle, frequently with leverage.
Early bear: denial. The decline is a healthy correction and a buying opportunity.
Mid bear: fear, and selling begins.
Late bear: capitulation. Everything is sold near the low, and the resolution is to never do this again.
Recovery: paralysis. Prices rise and the pain is too recent to act on, so the next cycle begins from the sidelines.
The net effect is buying high and selling low, executed with complete sincerity at every step. This is loss aversion operating at the scale of a market cycle, and knowing about it helps less than having a written plan that does not require you to decide during either extreme.
Cycles, not anomalies
Bull and bear markets are not failures of the system. They are what the system does. Expansion and contraction, optimism and fear, in a rhythm that has governed markets for as long as there have been markets and will continue to.
Predicting exactly when each phase begins and ends is not achievable, and the people who claim otherwise are describing the past. What is achievable is recognizing roughly where in the cycle you are (early or late, expanding or contracting) and adjusting exposure and expectations accordingly.
The 20% rule tells you what has already happened. Breadth, credit and sentiment tell you something about what is happening now. Neither tells you what happens next, and the discipline of accepting that is worth more than any framework for predicting it.