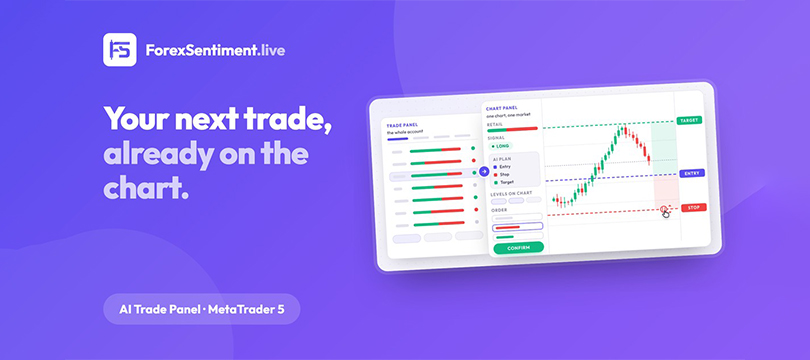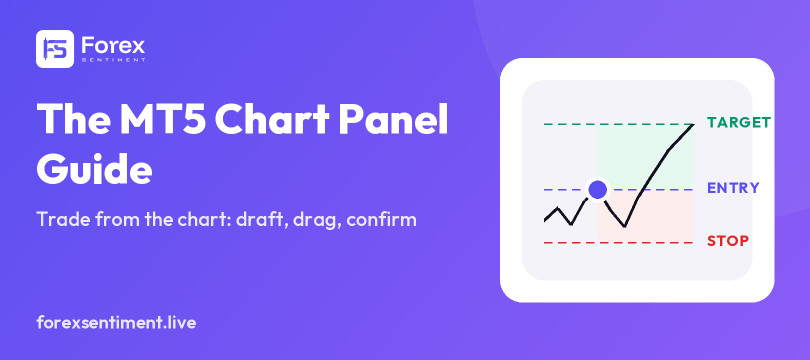
An MT5 chart panel is the part of a trade panel that sits on the chart itself: a narrow strip beside the candles, with the order form, the levels and the lines you drag to shape a trade. The ForexSentiment Chart Panel is that strip. It is a second Expert Advisor that arrived with version 1.8.0 of the Trade Panel for MetaTrader 5; it comes in the same zip file, works with the same license, and costs nothing extra. This guide explains what it does, what MetaTrader 5 already does on its own, and the few things the Chart Panel will never do.
If trade panels are new to you, the MT5 trade panel guide explains what they do and how to choose one. If you have not met the Trade Panel yet, the screen-by-screen walkthrough covers it. This page is about the second Expert Advisor, and it starts from the chart.
What MetaTrader 5 Already Lets You Do From the Chart
Before the panel, it helps to know what the terminal does by itself, because a good part of trading from the chart is already built in. The MetaTrader 5 help, read on 3 October 2026, describes three things.
The first is the One Click Trading panel: “A special panel allows performing instant trade operations directly on a chart”, and with it “you can instantly send buy or sell market orders with specified volumes”. Instant is the operative word. The help’s settings page is explicit that the one-click trading option “allows performing trade operations in one click without additional confirmation by trader (trade dialog is not displayed)”. The volume is a number you type into the panel; nothing on the screen tells you what that number means in money.
The second is pending orders from the chart’s context menu: “Place the mouse cursor on the necessary price level on the chart and execute the appropriate context menu command to set a pending order.” The price comes from where the cursor is.
The third is dragging. Once an order or a position exists, its trade levels are drawn on the chart and can be moved: “left-click the necessary level and drag it to the desired value”, and “Drag the price line to modify the entire order”. Two settings under Tools → Options → Charts govern it: “Show trade levels”, and a choice that disables dragging, enables it, or enables it only with the Alt key held (“Enable dragging of trade levels with ‘Alt’ key”). Of that last option the help notes that “By default, without enabling this option, the orders and stop levels are moved using a mouse (drag’n’drop)”. While a level moves, the help adds, “a tooltip appears displaying potential profit (or loss) in the deposit currency and pips that can be obtained if the level triggers”.
So MetaTrader 5 lets you send a market order in one click, place a pending order at the cursor, and drag the stop or the target of something that is already at the broker. What it does not do comes in four parts. It does not size the position from the risk you accept. It does not tell you the money at risk and the reward before the order leaves. It does not let you drag the lines of an order you have not sent yet. And it does not draw levels it does not compute itself: published supports and resistances, a trade plan, the pivot, the session ranges. That gap is where a chart panel earns its place.
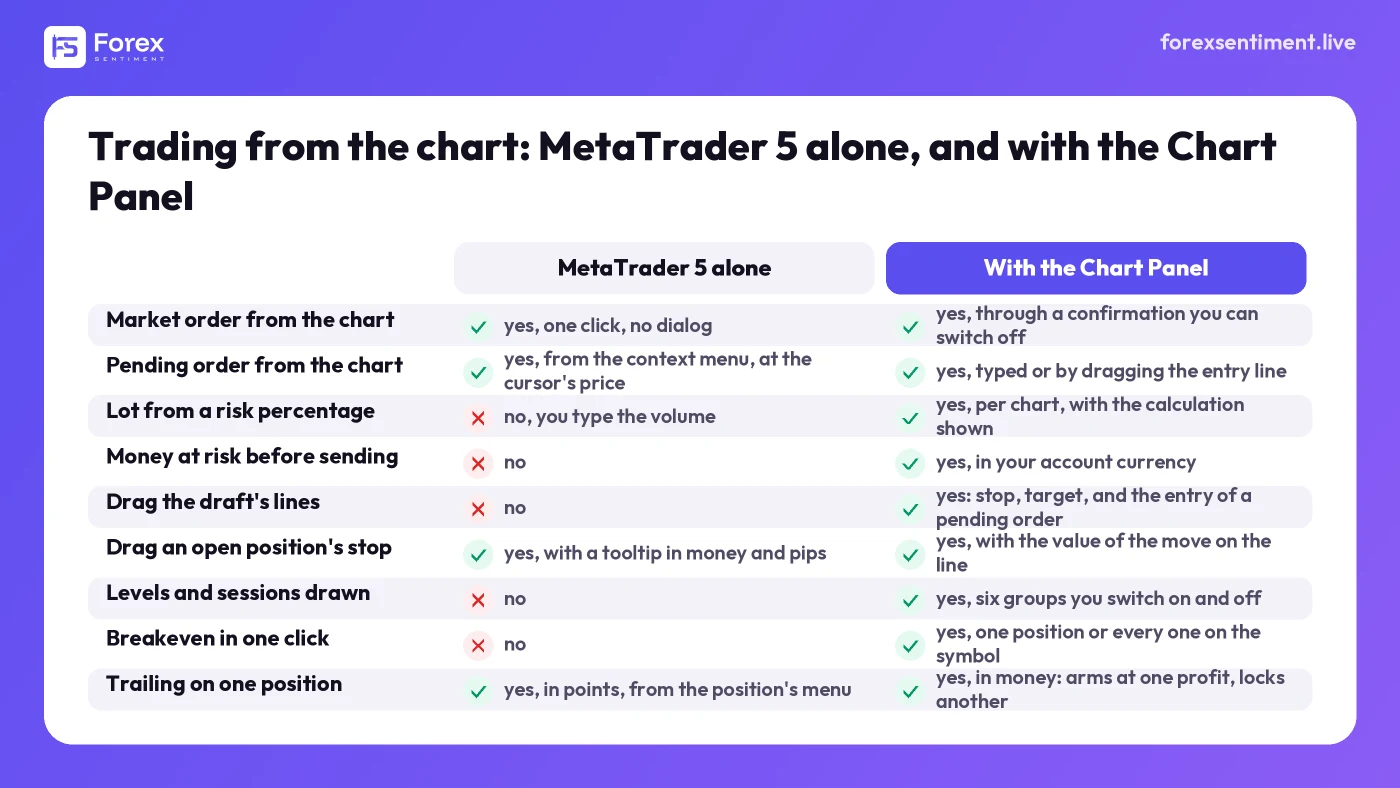
What MetaTrader 5 lets you do from the chart on its own, as its help describes it, and what the Chart Panel adds on top. Nothing in the right column opens a trade without your click; the trailing, once you arm it, moves the stop by itself.
What the Chart Panel Is
The Chart Panel is a narrow side panel that sits in the top-left corner of any MetaTrader 5 chart and works on that chart’s market only. For that one symbol it shows three things. The retail positioning is the share of retail traders long and short. The ForexSentiment signal reads long, short or neutral, and is built from the site’s five factors. The AI plan of the day gives an entry, a stop and two targets; an AI model writes it the evening before each trading day, and it is checked against real prices afterward. The Chart Panel draws the levels of the last two on the candles, and it holds the controls to open, protect and close a trade without leaving the chart.
It is a companion to the Trade Panel, not a replacement. The Trade Panel keeps its own chart and keeps doing three things the Chart Panel never does: it is the one that receives the retail positioning, the signals and the AI plans; it is the one that holds the license; and it is the one that raises the market alerts. The Chart Panel takes all of that from the Trade Panel, so there is no license code to type and no data connection to authorize a second time.
Two consequences follow. The Chart Panel needs the Trade Panel open on another chart of the same terminal; on its own it has nothing to read, and it says so instead of showing yesterday’s numbers as if they were today’s. And MetaTrader allows one Expert Advisor per chart, so a chart carrying the Chart Panel cannot run another Expert Advisor, and the Trade Panel’s own chart has no room for it. The rule that governs the rest of the product holds here too: nothing opens a trade on its own, and nothing changes one unless you set it up, as with a trailing you armed or a protection you switched on in the Trade Panel. Every order starts from your click, and a pending order always goes through the confirmation window.
The header is the same on every tab, and it has four rows.
- The symbol and the current bid, with the broker’s own name for the symbol underneath if it differs.
- A colored dot and one line on the state of the data.
- RETAIL: the split bar, the long and short shares, a crowding chip that reads BALANCED, CROWDED or EXTREME, and the change in the long share over the last 21 days.
- POSITION: what you hold on that symbol, in lots, at what average price, and the floating result.
Under the header sit three tabs: Manual, Signals and Forecast. A small indigo dot next to the last two means there is something to act on, a directional signal or an AI plan of the day. On a neutral reading there is no dot, because a dot would promise a trade that is not there.
Building an Order on the Chart
Manual is the tab that needs none of the site’s data: it works on any symbol your broker offers, whether or not it is one of the 29 markets the site covers (28 currency pairs and gold). You pick BUY or SELL, then TYPE decides between Market and Pending. With Pending an ENTRY field appears, the panel names the order it is about to send, “= Buy Limit” for instance, and tells you how far that price is from the market.
The LOT field takes a number with Fix, or sizes the position from your risk with the % chip and the box beside it. The line underneath shows the whole calculation, for example “1.0 % of equity 99638.06 → 1.94 lots”. That percentage belongs to the chart; at zero, the chart falls back to the percentage set in the Trade Panel. The arithmetic is the one the site’s lot size calculator does; there you type a balance, here the equity is read from your terminal.
SL and TP each accept five ways of being expressed: Price, Pips, Money, Level and None. The chips under the field say which one is in use. Level pins the stop or the target to one of the levels the site publishes. Money asks for a fixed lot, because an amount and a risk percentage cannot both decide the size. Next to the field you always get the other reading: the distance in pips (points on gold) and what it is worth in your account currency. On a pending order, EXPIRES offers Gtc, which keeps the order at the broker until you cancel it, and Day, which asks the broker to kill it at the end of the trading day. If your broker refuses an expiration altogether, the panel says so rather than sending a GTC order under a chip that reads Day.
Above the button sits the summary you are agreeing to: RISK and REWARD in money, and the ratio between them. Below the button, one line says what the order would do to the account as a whole: “account risk after this order”, as a percentage of equity. It adds the risk already open on the whole account to the risk of the order you are building. The figure in brackets, “now”, is the account’s risk before this order: it is the same on every chart, while the first figure changes with the order each chart is preparing. The button carries the order in words, “PLACE BUY LIMIT 1.00 @ 1.15168”, so nothing is left to guess at the moment of the click. When the button is gray it is not broken: it is telling you what is missing, in the same place, before the click rather than after a rejection. Three messages you will meet are “write the entry price”, “market closed for this symbol right now” and “not enough free margin”. Two cases always ask, even when you have switched confirmations off: a pending order, and an order with no stop at all. For the second, the dialog writes “no stop loss: unlimited risk” in amber, because the risk there is not zero, it is unknown.
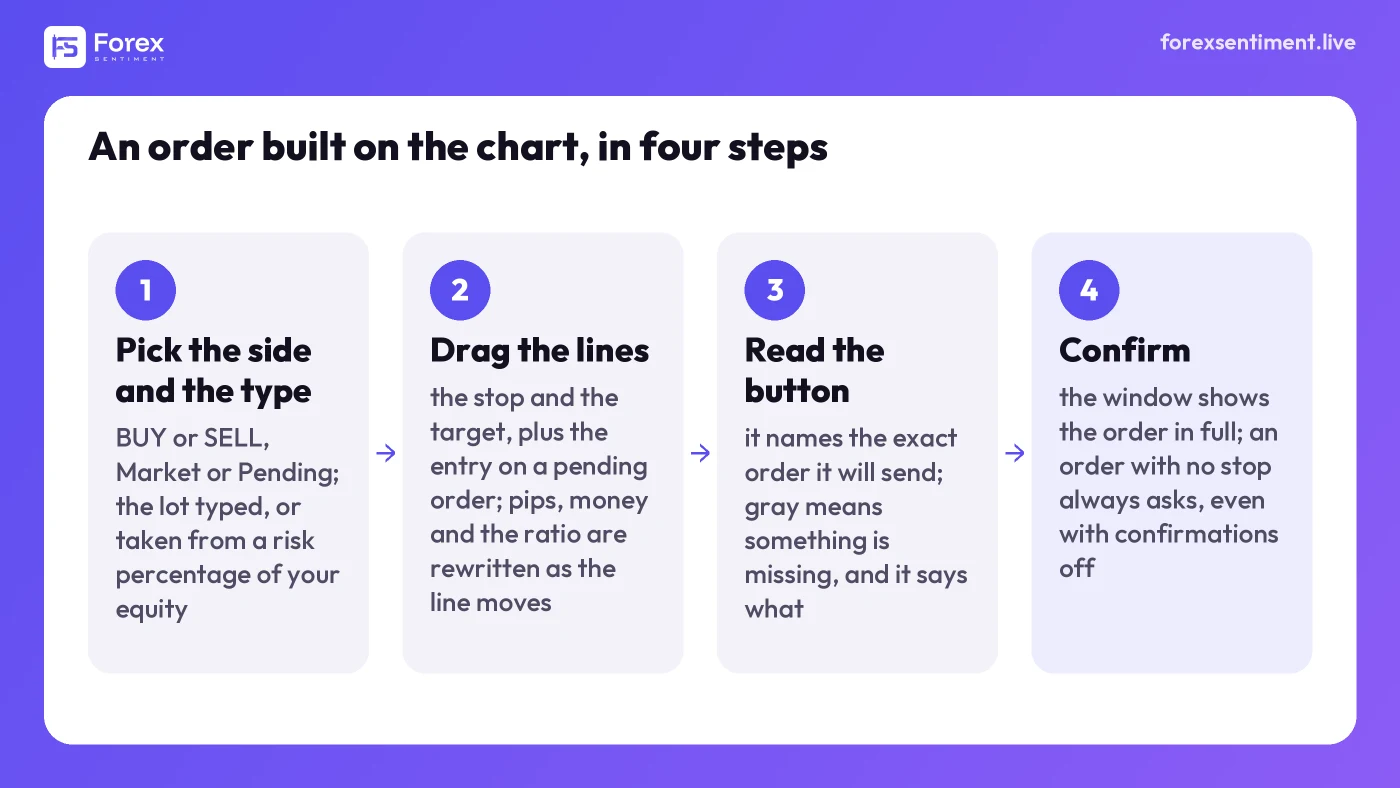
Building an order on the chart with the Chart Panel: side and type, the lines dragged into place, the button that names the order, the confirmation. The order leaves only after your click; a pending order, or one with no stop, always goes through the confirmation first.
While you build the order, its lines are already on the candles: the stop in red, the target in green, the entry as soon as the type is Pending, with a shaded area for the risk and one for the reward. That is the draft. The Order draft chip, on the title line of the levels legend at the foot of the panel, hides it when you want the chart clear while you read it.
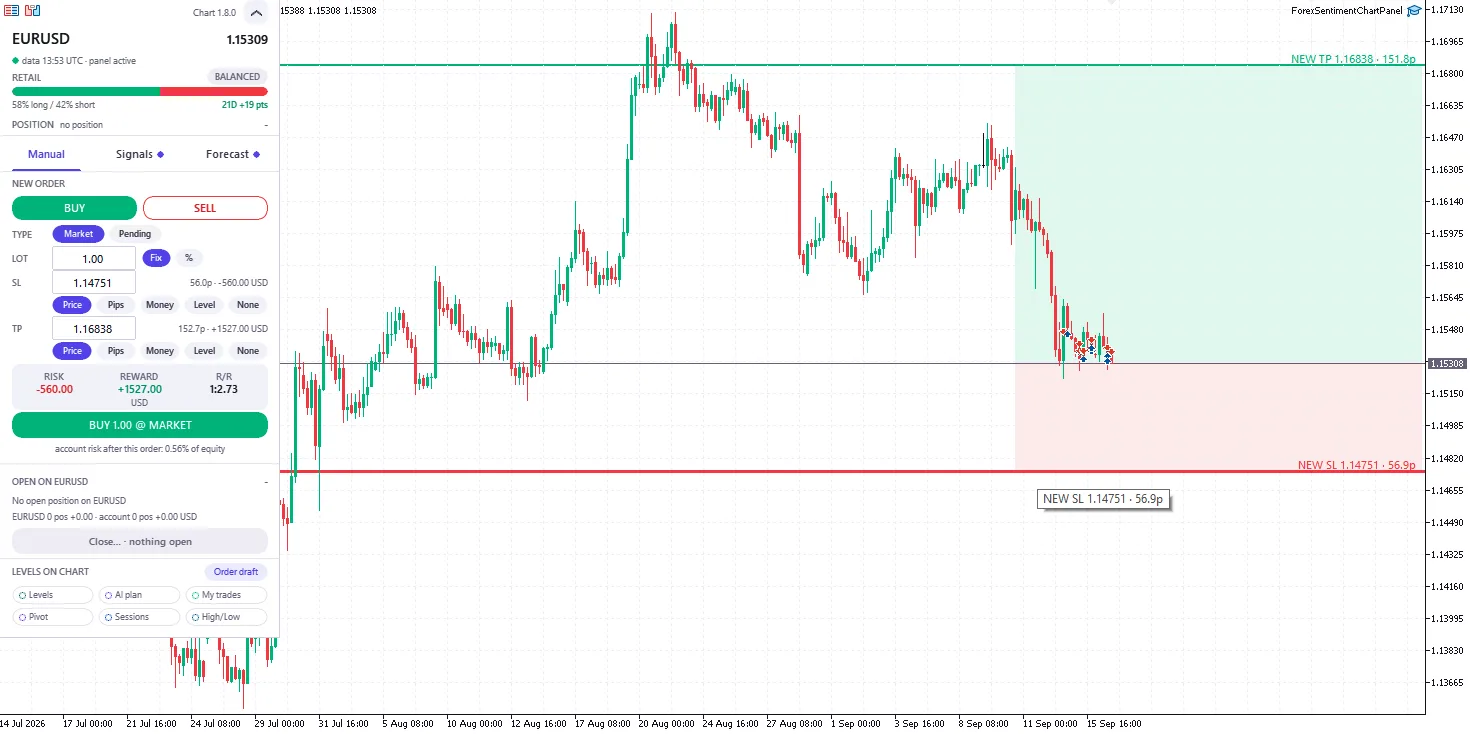
A market buy on EUR/USD being drafted, mid-September 2026: the stop line is being dragged on the chart and the side panel rewrites the stop price, the money at risk and the reward-to-risk ratio as it moves. Nothing has been sent yet.
Dragging the Lines
Every line the panel draws for a trade is also a control. Take it with the mouse, move it, and the numbers in the side panel follow the pointer. On a position or an order already at the broker, the change is sent when you let go, never during the gesture. While you compose an order, letting go only updates the form: nothing leaves until you press the button.
- On the order you are composing, the lines are the stop and the target, plus the entry as soon as TYPE is Pending. This is the fastest way to build an order: put the stop where the idea stops being valid, put the target where you want to be paid, and read the risk and the ratio as you move. Where that stop belongs is a question of its own, covered in where to place a stop loss in forex.
- On an open position, dragging moves the stop or the target already in force. The label on the line carries the price and what the move is worth while you are still dragging the line.
- On a pending order already at the broker, you can also drag the entry, and the stop and the target travel with it by the same distance, in the same request to the broker. The risk therefore does not change, and the line says so: SL/TP follow, with the amount. You can never drag the entry through its own stop, because the stop moves with it. The only limit is the market itself: a buy limit has to stay below the price and a sell limit above it, and the line tells you if you go too far.
When you compose a pending order in the Manual tab, whether the stop and the target move with the entry depends on how you wrote them. The panel writes the rule under the chips: Pips and Money follow the entry, Price and Level stay put. A distance is measured from the entry; a price is a place on the chart. Once the order is at the broker, dragging its entry always carries the stop and the target with it.
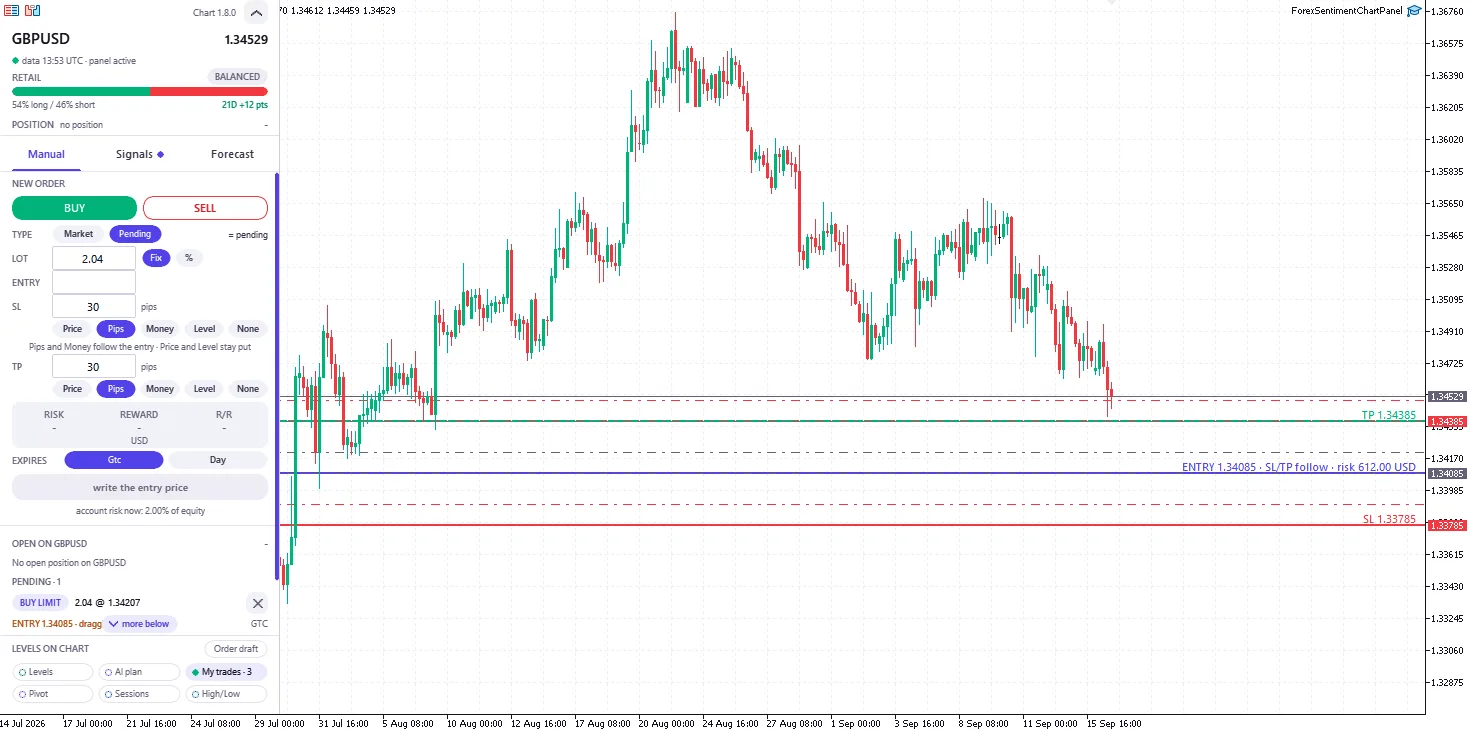
A pending buy limit on GBP/USD dragged by its entry line, mid-September 2026: the stop and the target travel with it, the label on the line says so and keeps the risk at 612.00 USD, and the order’s row, in the list under the form, follows the drag.
The Levels on the Candles
The foot of the side panel is the switchboard for what gets drawn on the chart: six groups, each a chip you turn on and off, and each chip that is on showing how many objects it is drawing. Out of the box the first three are on.
- “Levels”: the supports and resistances of the site’s signal for this market, up to three on each side, labeled R1, R2, R3 above the price and S1, S2, S3 below it, and its key zone, the level near the price where the analysis finds the most confirmations, with its score.
- “AI plan”: the entry, the stop and the two targets of the AI plan of the day.
- “My trades”: the entry, stop and target of your open positions and pending orders.
- “Pivot”: the classic pivot point alone, computed from your broker’s own daily candles, so it matches the prices on your charts. The R and S labels on the chart belong to Levels, not to the pivot.
- “High/Low”: the high and low of the day and of the week, which move with the market.
- “Sessions”: one outlined box for each trading session of the last visible days, Sydney, Tokyo, London and New York, from the high to the low the market reached during that session, with its name beside it. Nothing is filled in, so no candle is hidden. The boxes need an hourly chart or a shorter one: on H4 and above nothing is drawn, and the chip says so.
Where several of them land on the same price, the labels are stacked into one. That is how a glance tells you that the plan’s stop is also a resistance, or that your target sits on the weekly low.
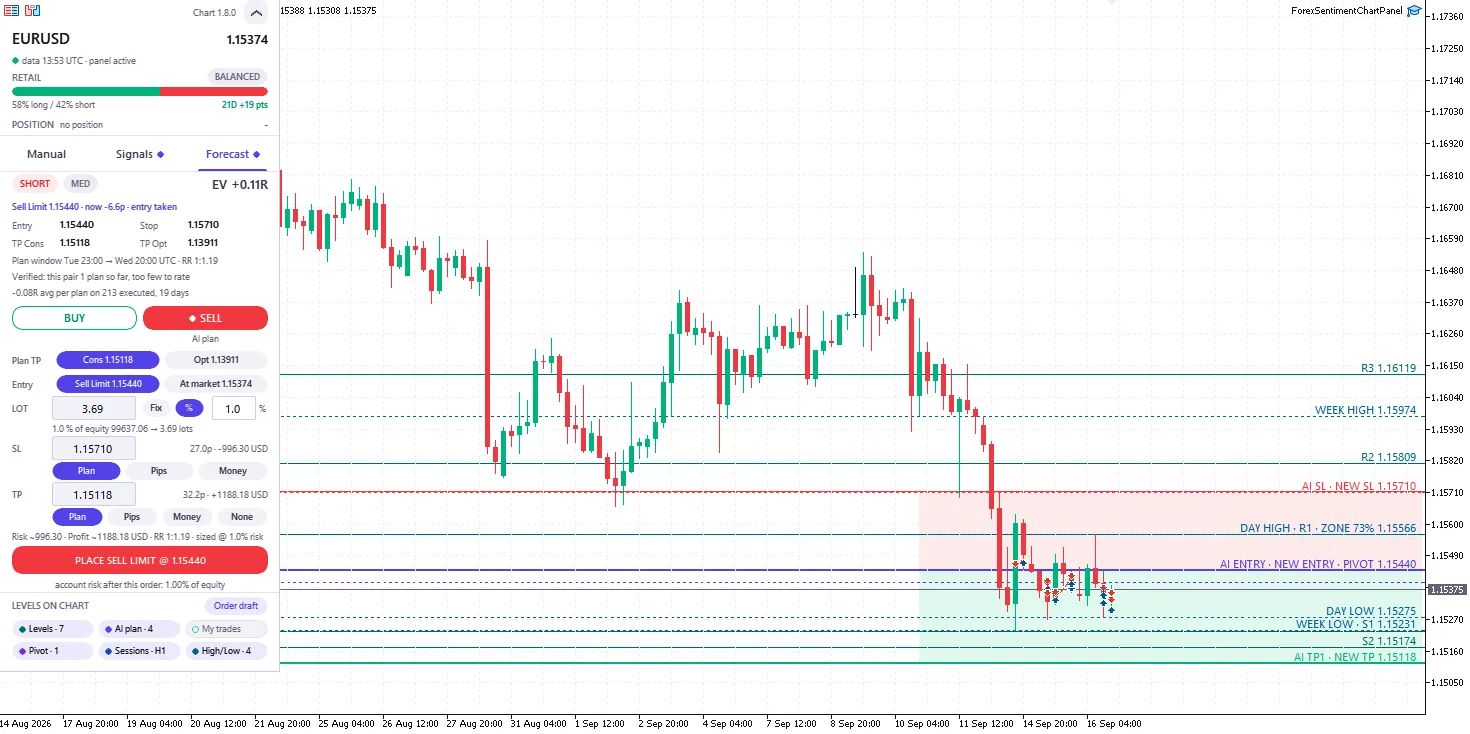
EUR/USD on a four-hour chart with Levels, AI plan, Pivot, High/Low and the order draft switched on, mid-September 2026: ten labels, and where two or three fall on the same price they are stacked into one, so the day high, R1 and the key zone read as a single line. Sessions is on as well; above H1 it draws nothing, and its chip says so.
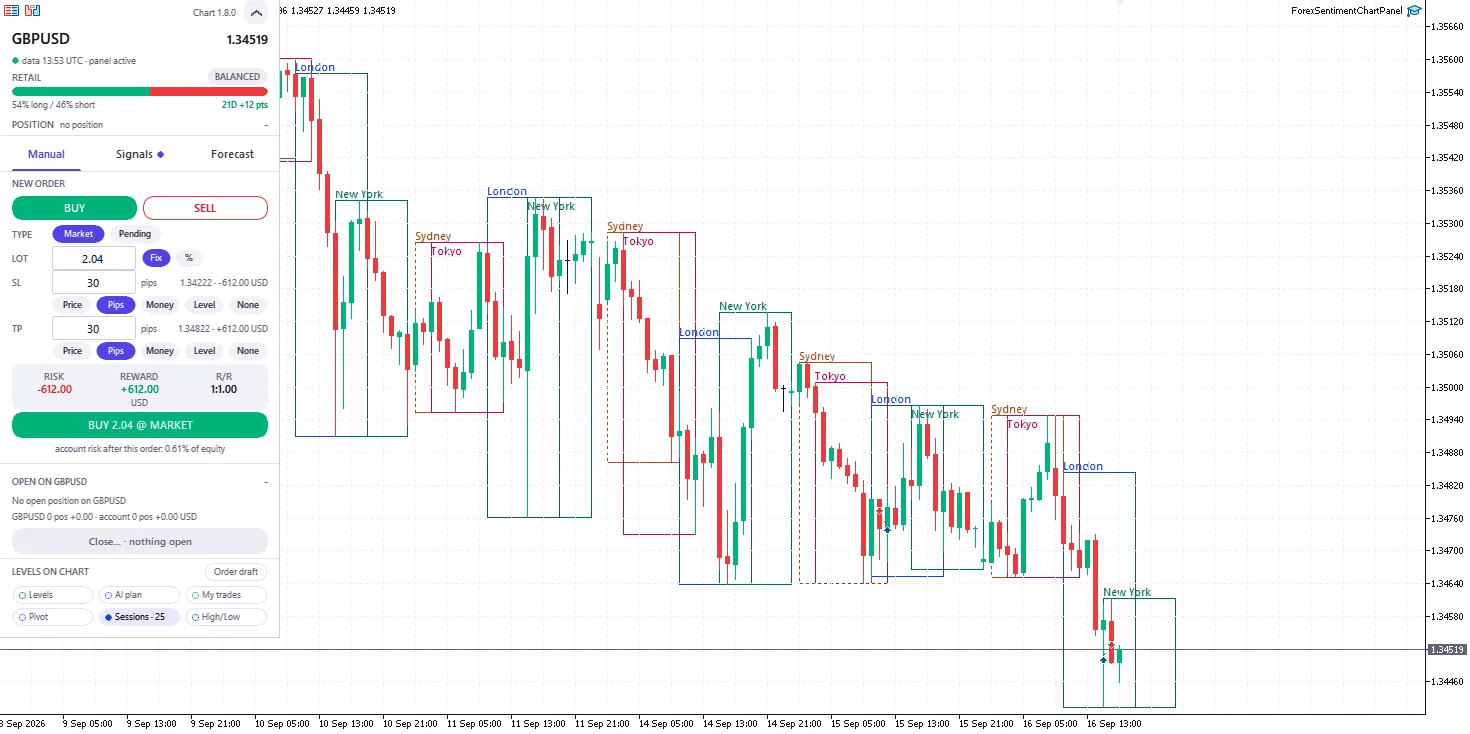
The four sessions boxed on a GBP/USD hourly chart whose axis runs from 8 to 16 September 2026: Sydney, Tokyo, London and New York, outlines only, from the high to the low each session made.
Trading the Signal or the AI Plan From the Chart
The Signals tab opens with the site’s signal for this market, laid out as on the Trade Panel.
- Direction and confidence. Confidence is how much the factors that took a side agree with one another.
- The strength number with its bar.
- The volatility regime: it describes the state of the market, it does not judge the trade.
- The consensus split: the factors’ combined score shown as a long and a short percentage, so 50/50 means they cancel out.
- The analysis price with its age, and the distance the market has traveled since.
- The nearest support and resistance, and the key zone.
- The pattern on the candles and the correlation reading.
- When the direction last changed.
The same reading is published for every covered market on the signals page, refreshed every three hours on weekdays.
Below the signal, the tab shows BUY and SELL and one button. The signal’s own side is marked by the same indigo dot the tab uses, with the word signal below it. Choosing the other side does not move that dot: it stays on the signal’s side, so you see at a glance that you are going the other way. The button then reads “against the signal”, and an amber line names the reading you are trading against. The order leaves with the comment FS Panel REV, so your reverse trades stay countable apart from the rest. On a neutral signal there is no dot and the button stays gray until you pick a side.
Stop and target here have three modes, Auto, Pips and Money, and the target adds None. In Auto a row of level chips appears: Nearest, and up to three named levels for your side. The Auto target works exactly as on the Trade Panel, and that is deliberate. When you move the stop out to a farther level, the Auto target stays where the automatic stop had put it, and the ratio falls. A target that widened along with the stop would keep the ratio at 1:1 whatever you did, which is a number that has stopped measuring anything. The row says which stop the target was measured from.
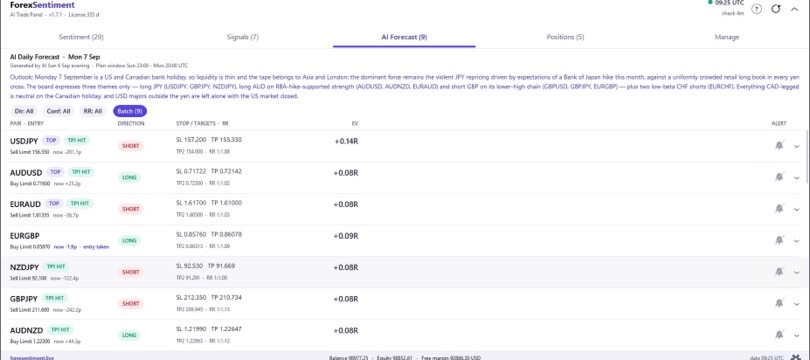
If the AI plan of the day covers this market, the Forecast tab lays it out.
- Direction and confidence; here the confidence is the AI model’s own rating of its plan.
- The EV, the expected value: what the plan is expected to return, on average, per unit of risk.
- The order as it stands, for example “Sell Limit 1.15440”, with how far the price is from it.
- The entry, the stop and the two targets.
- The hours the plan is valid.
- The verified record, for this pair and for all plans.
Plan TP chooses between Cons and Opt, the conservative and the optimistic target, each chip carrying its price. Entry chooses between the plan’s own limit price and At market at the current quote. The button then names the exact order. Two notes appear on the order line when they apply.
- “entry taken” means the price has already been through the plan’s entry today, so a pending order there would have filled.
- “plan window over” appears only with brokers that refuse expiration dates. Normally a pending order from a plan expires by itself when the plan’s hours are over; with those brokers it stays at the broker instead, the note appears, and a cross beside it cancels the order. Nothing is canceled over your head.
When the AI reads a market as directionless there is no plan, and the tab says exactly that instead of drawing a form with no numbers in it. It is not a failure of the panel: on a normal day the AI publishes a plan for a minority of the markets it covers. How the plans are written and judged is on the Daily Forecast page, together with the record every plan is checked against. The Forecast tab reads the same record, cut two ways: this pair’s own plans, and the average result per plan across all markets. Here is that record as the site publishes it, split between the AI’s daily picks, up to three a session, and every plan it publishes.
The verified record, as it stands today. Every figure below is read from the published record when this page loads; the record grows by one session every trading evening.
- The three plans picked each session: 61 filled plans over 31 verified days, average result +0.07 × the risk taken per plan. Target reached on 18%, stop hit on 28%, expired before either level on 54% of them. On a sample this size the average carries a range from -0.12 to +0.27 per unit risked, wide enough to include zero.
- Every plan on the board, including the ones marked not to take: 277 filled plans, average result -0.04 × the risk taken; stop hit on 22%, expired on 68%.
Compiled by this site's own script on real candles, published win or lose, not audited by a third party. Neither number is proof of anything yet: the sample is small and it is published anyway.
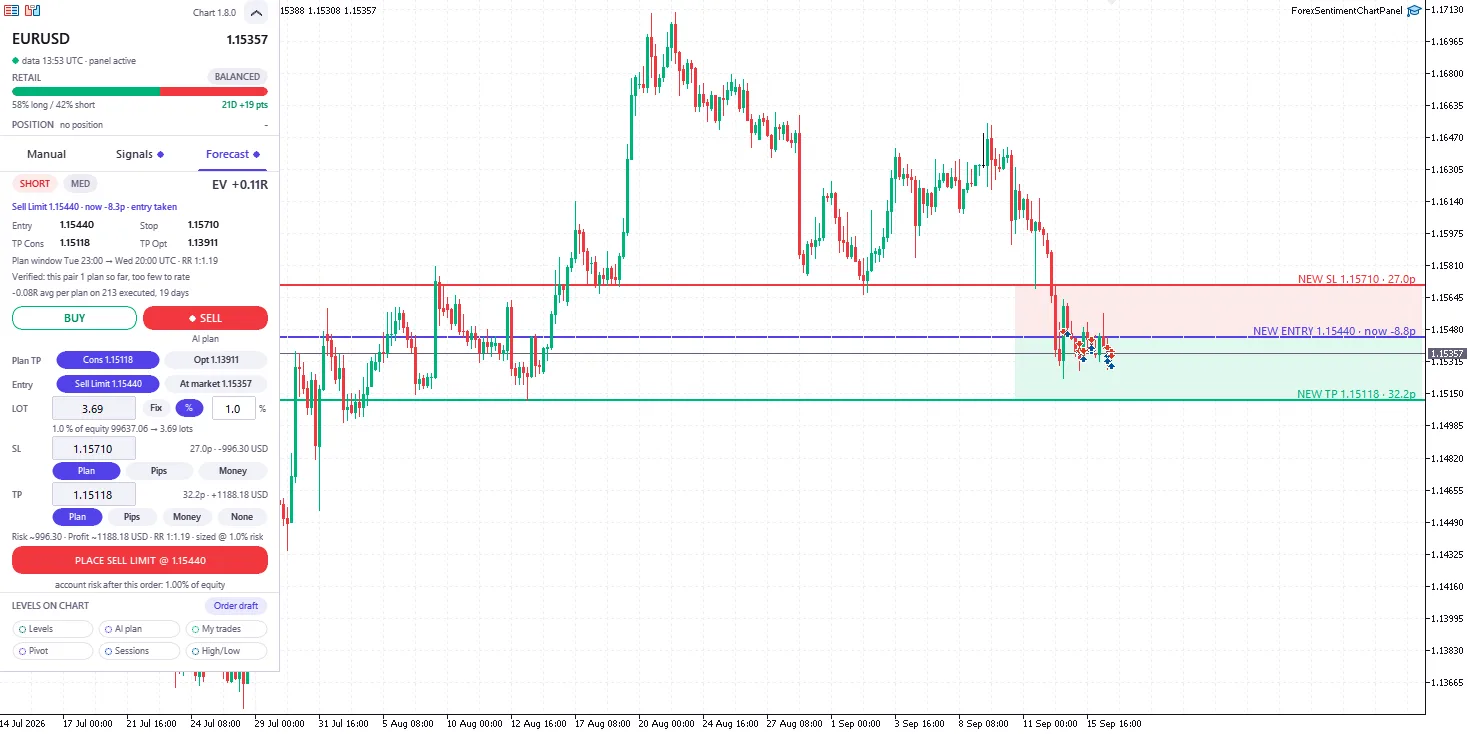
The AI plan of the day for EUR/USD as the Chart Panel laid it out in mid-September 2026: a sell limit with its stop, its two targets and its hours, the lot sized at 1% of equity, and the three lines of the draft on the candles. The numbers are those of that day, not a recommendation.
After You Are In: Breakeven, Trailing, Close
Below the form, the panel lists what you hold on this symbol: one row per position, then the pending orders. Each position row carries the side, the lots, the entry price, the floating result, the stop and target in force, and a label saying where the trade came from.
- AI PLAN: a trade opened from the AI plan of the day.
- MANUAL OVERRIDE: a plan you have since taken over by hand.
- SIGNAL: a trade opened from the site’s signal.
- REV: a reverse order.
- MANUAL: an order composed in the Manual tab.
- OTHER EA: a trade that does not come from the ForexSentiment Expert Advisors.
BE moves the stop to the entry price. Under the list the same button appears once more, as “BE each” with a count, to do it to every panel position on the symbol in one go; beside it, BE average puts one stop at the average price of those positions, offered only while they all sit on the same side. The cross on the right closes a position, or cancels a pending order, through the same confirmation an order gets. Close… at the foot opens a short menu instead of acting straight away, because “close everything” means several different things. The menu offers six ways to close, each with its own count and its own floating result:
- only the manual trades on this symbol;
- only the AI plans;
- only the signals;
- everything on the symbol;
- every panel position on the account;
- truly everything on the account, the one line marked in amber, because it also closes what you opened by hand or with another Expert Advisor.
A line of its own cancels the pending orders, because canceling is not closing.
The Trade Panel trails the account as a whole; here you can trail one position. Press the TRAIL chip on its row, which reads “TRAIL off” until you arm it, and two boxes open: Arms at, the profit at which the trailing starts working, and Locks, the profit it secures at that moment. From there the stop follows every new profit peak, always staying behind it by the gap between the two numbers. With 500 and 350, as in the screenshot below, the stop goes to +350 when the profit reaches +500, then stays 150 behind the highest profit reached: if the profit climbs to +630, the stop is at +480. Both numbers are the position’s profit before commission. The stop moves in small steps, about one pip on a currency pair, rather than at every tick, so the broker is not sent one modification a second. If the distance between the two numbers, turned into price, is smaller than the minimum distance your broker asks of a stop, the panel does not arm the trailing and tells you how far apart they need to be.
MetaTrader has a trailing stop of its own, set in points from the position’s context menu, and it is worth knowing how the two relate. The terminal’s, in the words of its help, “is executed in the trading platform rather than on the server like Stop Loss”, so “it will not work, unlike the above orders, if the platform is off. In this case, only the Stop Loss level set by the Trailing Stop will trigger.” The panel’s trailing works the same way: it advances from your terminal, and every step is a stop order deposited with the broker, so if MetaTrader closes, the last stop it set is still in force. What stops is the advancing, until a Chart Panel is running on that symbol again. What the panel adds is the way you set it: in money rather than points, with the arming level and the locked profit as two numbers, and, when the profit is already past the arming level, with the line under the boxes telling you where the stop will go before you press Arm. MetaTrader shows a warning if you take the Chart Panel off a chart while a trailing is armed and no other chart on that symbol has the panel. And if you have two charts open on the same symbol, only one of them moves that stop, so a position is never trailed twice.
The protections in the Trade Panel’s Manage tab work on the account, and the Chart Panel’s orders are part of that account: they carry the same magic number, the identifier an Expert Advisor stamps on its orders, which is exactly what lets both panels see the same trades. So when the max loss, the max profit, the account trailing, the close before rollover or CLOSE ALL fires, it closes those positions too and, if the switch for pending orders is on, cancels the pending ones on every chart. Rollover is the daily changeover at the New York close, when spreads widen. The chart that lost a pending order is told: a message stays on screen until you dismiss it and names the rule that fired. What those rules do, and what they cannot do, is the subject of trade management after entry.
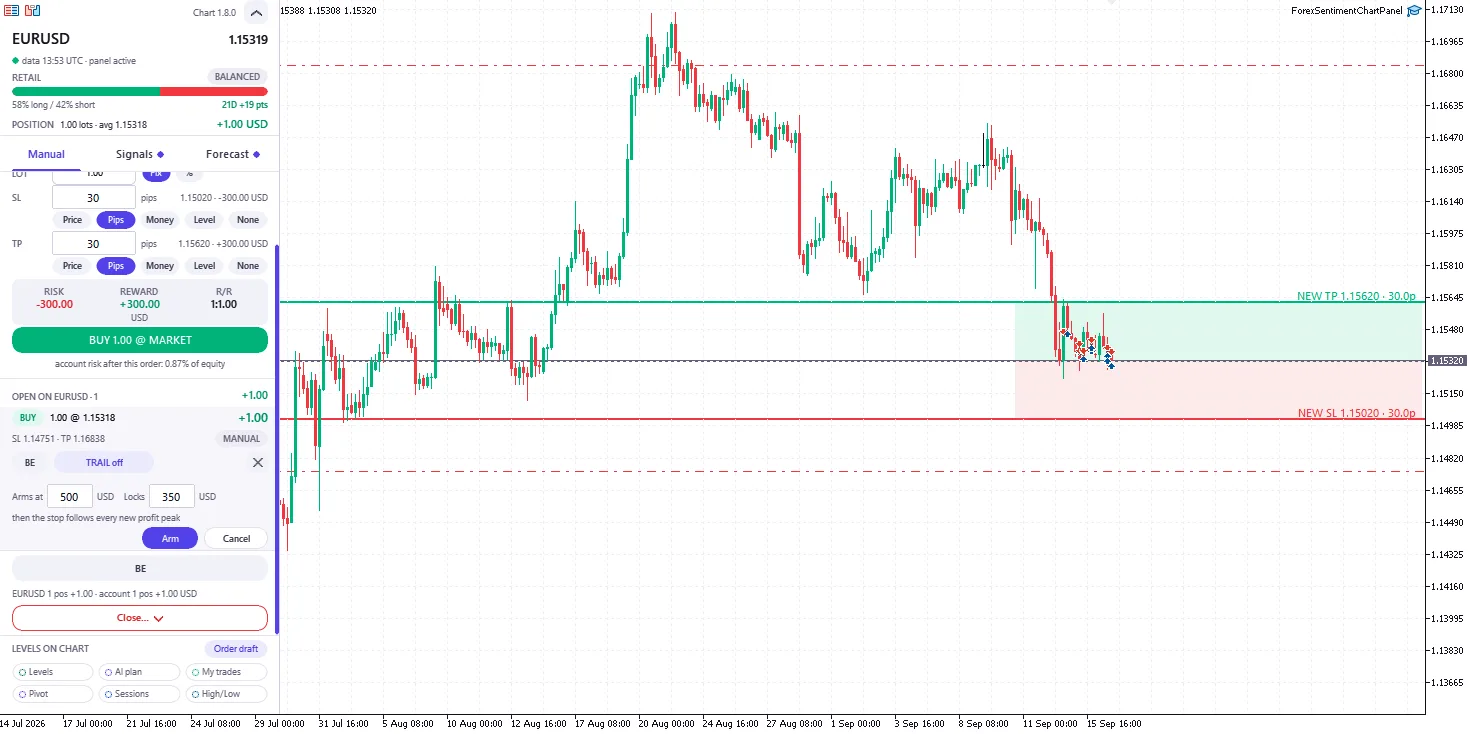
An open EUR/USD position in the Chart Panel, mid-September 2026: the row with its origin label, the breakeven button, and the trailing editor asking at what profit to arm and how much to lock. Below it, the Close… button and the chips for the levels.
What It Never Does
The list is short, and its first line is the one the Trade Panel keeps too. The Chart Panel never opens, reverses or scales a position by itself: every order starts from your click, a pending order always goes through the confirmation, and an order with no stop always asks even when confirmations are off. It never fetches data for itself and holds no license: the Trade Panel does both, on its own chart, and passes the data on. It never raises a market alert: the alerts on signals, retail positioning and plan entries, for every market, stay in the Trade Panel. It does not close part of a position: a position closes whole, from the cross on its row or from the Close menu. And it cannot share a chart with another Expert Advisor, because MetaTrader runs one per chart.
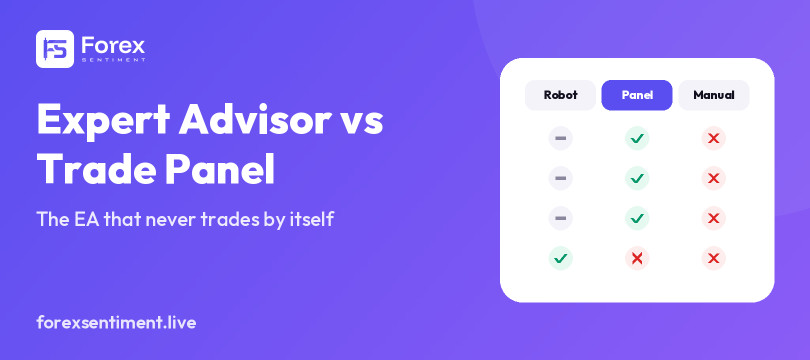
Why that first line matters more than any feature is the subject of Expert Advisor vs trade panel: an Expert Advisor is a category, not a behavior, and the difference between a robot and a panel is who decides the trade.
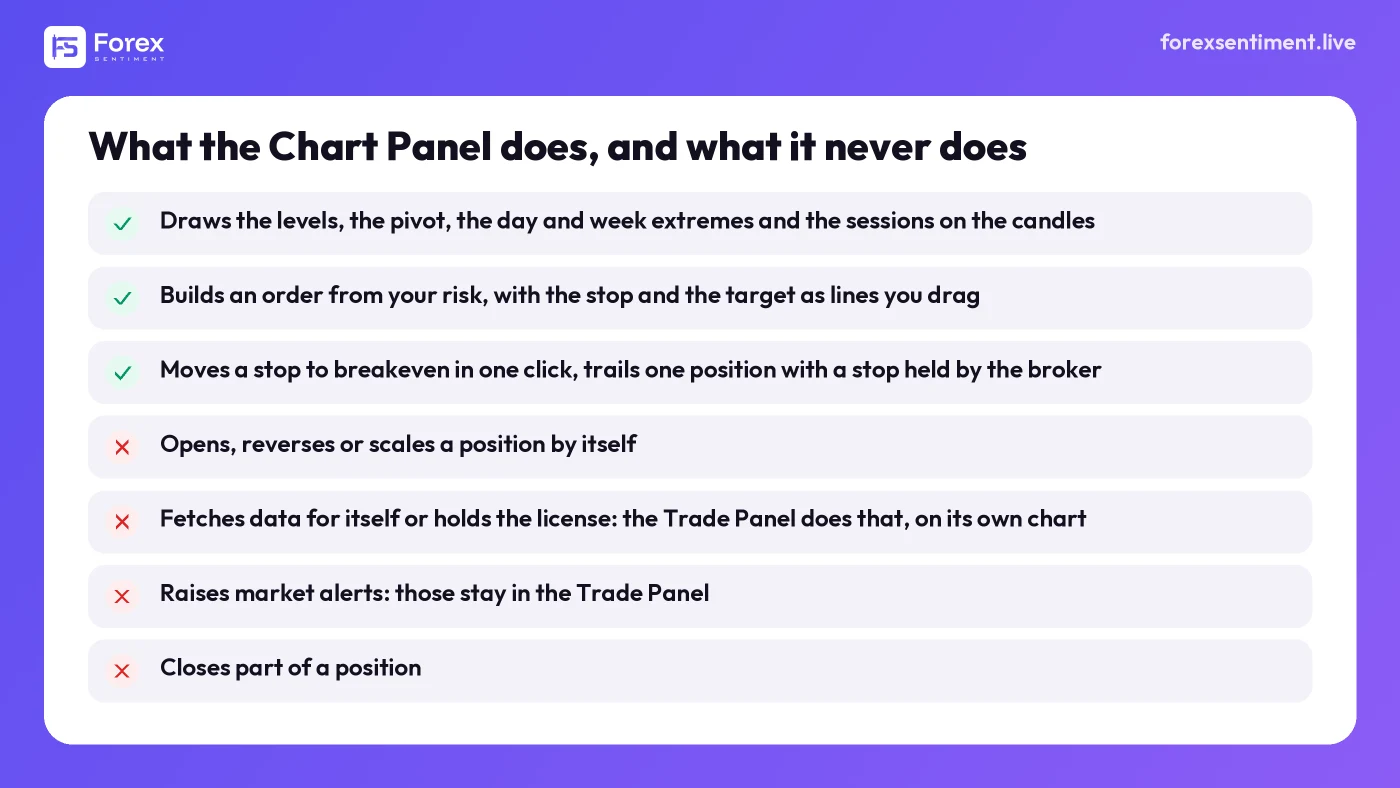
The Chart Panel draws, sizes and protects; it never opens a trade on its own, never fetches data for itself or holds the license, never raises a market alert, and does not close part of a position.
Installing It
- The zip file carries two Expert Advisors: ForexSentimentPanel.ex5 and ForexSentimentChartPanel.ex5. Copy both into MQL5 → Experts, as the user guide shows. When a new build ships, replace both in the same pass: two different versions do not talk to each other.
- Right-click Expert Advisors in the Navigator and choose Refresh. Both now appear in the list, one under the other.
- Leave the Trade Panel where it is and drag ForexSentimentChartPanel onto every other chart you want it on: one per chart, any symbol, any timeframe. The dialog has two settings and neither is a license. Panel size % goes from 80 to 200: lower it on a cramped screen, raise it on a large one. Start collapsed opens the side panel as a single bar. F7 reopens the dialog at any time.
- Optional, and quicker than dragging it onto thirty charts: the zip also carries two chart templates, light and dark. Copy them into MQL5 → Profiles → Templates, then right-click a chart, choose Templates and pick one. The template sets the chart colors, leaves room on the right so the labels do not land on the last candles, and attaches the Chart Panel in one go. Save it under the name Default and every new chart is born with the panel on it. Two warnings from the guide. Applying a template wipes whatever was on that chart, indicators, objects and lines you drew by hand, so use it on a chart you are setting up. And never apply it to the Trade Panel’s own chart: one Expert Advisor per chart means the Chart Panel would take its place, and the data, the license and the alerts would go with it, for every chart.
The first chart shows a welcome card with four reminders you cannot see from the panel itself.
- It needs the Trade Panel open on another chart of this terminal.
- Nothing here trades by itself.
- You set an order by dragging its entry, stop and target lines on the chart.
- Lot and risk percentage are set per chart, while the confirmation setting belongs to the Trade Panel.
Got it closes the card once for the whole account, not once per chart.
What It Needs, and What It Costs
It is included: one license covers both panels, and the current price of that license is on the Trade Panel page. It runs where Expert Advisors run, in the MetaTrader 5 desktop terminal, with the Trade Panel open on one chart. On markets outside the 29 the site covers (28 currency pairs and gold), the Manual tab, the pivot and the high and low of the day still work, because none of them depend on the site’s data; the retail positioning, the signal and the plan do not exist there, and the header says so. The signal and the plan are refreshed a few times a day and once a night, never tick by tick, and the side panel never pretends otherwise: when the data is old, the dot turns amber and the line gives its age.
On a prop-firm account the same rules apply as for the Trade Panel, since the orders are the same orders with the same magic number. Whether Expert Advisors are allowed at prop firms is covered separately, with FTMO’s own pages quoted.
Frequently Asked Questions
Is the Chart Panel a separate product? No. It is part of the Trade Panel since version 1.8.0: same zip file, same license, nothing extra to buy or activate.
Does it need the Trade Panel open? Yes, on another chart of the same terminal, any one. The Chart Panel takes the retail positioning, the signals and the AI plans from it, and holds no license of its own. Close the Trade Panel and every Chart Panel tells you, and stops placing orders until it is back.
Does it work on indices, crypto or anything outside the 29 markets? As an order composer, yes: the Manual tab works on any symbol your broker offers, with the lot from risk and the stop and the target as lines, and the pivot and the high and low of the day come from your broker’s candles. The retail positioning, the signal and the plan exist only for the 29 covered markets.
Can it open a trade by itself? No. It has no way to start a trade on its own: every order needs your click, and a pending order or an order with no stop always asks for confirmation. The protections of the Trade Panel can close or protect what is open; they never open anything.
Can half a position be closed? No. A position closes whole.
What happens to a trailing stop if MetaTrader is closed? The last stop it set stays at the broker, so the protection does not vanish. The stop stops advancing until a Chart Panel runs on that symbol again.
Can two charts on the same symbol both run the Chart Panel? Yes. They share the highest profit the trailing has reached and agree on which of them moves the stop, so a position is never trailed twice.
Related Reading
- The MT5 trade panel guide: what a trade manager does, what it cannot, and how to choose one.
- The Trade Panel, screen by screen: what each row shows and how an order goes out.
- One-click trading in MT5: how to enable it, why it is not showing, and what it cannot do.
- Where to place a stop loss in forex: the structural and the volatility method.
- The lot size calculator: the same arithmetic the panel does at the click, in the browser.
How This Guide Was Made
The description of the Chart Panel follows the Trade Panel user guide for version 1.8, chapter “The Chart Panel: one chart, one market”, and the product page, both read on 3 October 2026, with the behavior cross-checked on the screenshots shown here, taken in a MetaTrader 5 terminal in mid-September 2026 and untouched; a few labels have changed since: the account risk line, for one, now adds the “now” figure. What MetaTrader 5 does on its own is quoted from the MetaTrader 5 help pages on One Click Trading, platform settings and general trading principles, read the same day. Prices, lots and percentages visible in the screenshots are those of that day and are not recommendations. ForexSentiment makes the panel described here.