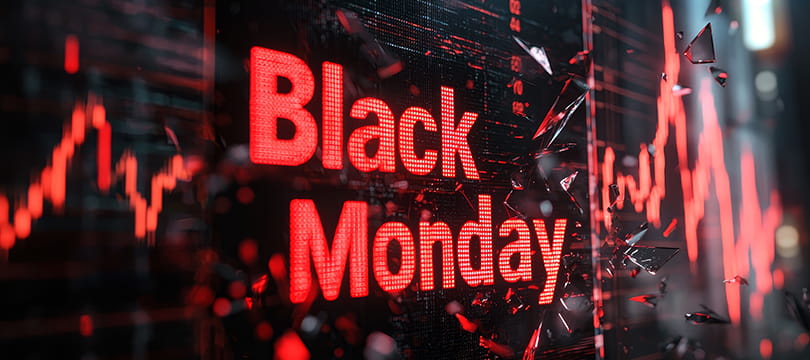
On Monday 19 October 1987 the Dow Jones Industrial Average lost 22.6% of its value in a single session. Nearly four decades later that remains the largest one-day percentage decline since the Dow has been continuously calculated, and nothing has come close.
What makes Black Monday 1987 worth studying is not the size of the number. It is that nobody can point to the thing that caused it. There was no war, no bank failure, no default. A market that had risen for five years simply came apart in six and a half hours, and the machinery built to protect investors did most of the damage.
Five years of one direction
The bull market that preceded the crash began in August 1982 and ran almost without interruption. The S&P 500 went from around 102 to about 337 in five years. The Dow rose from about 776 to a peak of 2,722 on 25 August 1987.
It was not only an American phenomenon. The nineteen largest equity markets in the world gained close to 300% on average over the same stretch. Money was flowing into stocks everywhere, and the flow was reinforcing itself.
By early autumn the mood had changed. US growth was slowing, the trade deficit was worse than expected, and interest rates were rising. The Dow had been drifting down from its August high for weeks. The market was not crashing, but it was nervous, and a nervous market that has gone up for five years has a great deal of unrealized profit to protect.
The week before
The crash did not arrive from a clear sky. It arrived at the end of a bad week.
On Wednesday 14 October, a House committee introduced legislation to strip the tax benefits from debt-financed takeovers (the fuel of the leveraged buyout boom) and the trade deficit came in unexpectedly wide. The Dow fell 3.81%. Thursday took another 2.39%.
Friday 16 October was worse: down 4.6% to 2,246.74. It was also an options expiration Friday, with the monthly options expirations coinciding with heavy index-arbitrage flow, which meant enormous volume and mechanical flows on top of the selling.
Then the weekend made it worse. Over the weekend (privately on the Saturday, then on the Sunday morning talk shows) Treasury Secretary James Baker signaled the United States might let the dollar fall further to address the deficit, read by markets as a threat to the Louvre Accord of February 1987, under which the major economies had agreed to stabilize the dollar, and as a reason to expect higher US rates. There was nothing anyone could do about it until Monday.
By the time New York opened, Asia had already been falling for hours.
The day itself
The opening was not a decline; it was a failure to open. Sell orders so far outweighed buy orders that market makers could not match them. Ninety-five stocks in the S&P 500 opened late, including eleven of the thirty Dow components. For a stretch of the morning, some of the largest companies in the world had no quoted price.
The Dow fell 508 points, from 2,246.74 to 1,738.74. In percentage terms, 22.6%. The S&P 500 lost 20.4%, the Nasdaq Composite 11.35%: its worst day at the time, and understated because many small stocks simply could not be traded.
Roughly half a trillion dollars of market value disappeared in a session.
The infrastructure failed alongside the prices. Investors calling their brokers could not get through; phone lines were saturated for hours. Rumors circulated that the New York Stock Exchange was about to close, which produced more selling from people who feared being locked in. In an era before real-time retail quotes, most participants could not see what was happening: only that it was bad.
Why it spread everywhere at once
Black Monday was arguably the first genuinely global financial crisis of the modern era, and the speed of the contagion shocked people who had thought of markets as national.
Some markets fell further than New York. New Zealand dropped roughly 60% from its peak and did not recover for years. Australia lost more than 40%. Hong Kong closed its exchange for four days and still could not stop the decline. The Nikkei fell 14.9% on 20 October. Because of time zones, the event is remembered in Australia and New Zealand as Black Tuesday.
Nothing had happened in Wellington or Sydney. The selling arrived because capital had become mobile and correlations, invisible in calm markets, turned out to be close to one when everyone wanted out simultaneously. That lesson has been relearned in every crisis since.
Portfolio insurance: protection that caused the loss
The mechanism most economists point to is program trading, and specifically a strategy called portfolio insurance.
The idea was elegant. Rather than buying put options to protect a portfolio, an institution could replicate the payoff dynamically: as the market fell, sell index futures; as it rose, buy them back. In theory this manufactured a floor at lower cost than paying option premium. By 1987, portfolio insurance covered somewhere around $60 billion to $90 billion of institutional assets.
The flaw was that the strategy required a liquid market on the other side, and it told every user to do the same thing at the same moment. Prices fell, the models generated futures sales, those sales pushed prices lower, and lower prices generated more sales. What was designed as insurance for individual portfolios became a selling engine for the market as a whole.
Index arbitrage carried the damage across. When futures fell below the value of the underlying basket, arbitrageurs bought futures and sold stock, transmitting the pressure from the futures pit into the cash market. Each mechanism was rational in isolation. Together, in a market with no bids, they produced a cascade that fundamentals could not explain.
This is the durable lesson: a hedge that requires you to sell into a falling market is not a hedge. It is a leveraged bet that liquidity will be there when you need it.
Greenspan's one sentence
Alan Greenspan had been chairman of the Federal Reserve for barely two months. On the morning of 20 October, before markets opened, the Fed issued a statement of a single sentence: it affirmed its readiness to serve as a source of liquidity to support the economic and financial system.
Behind that sentence, the Fed made calls. Banks were pressed to keep lending to securities firms on normal terms, which was the pressure point: brokers facing enormous margin calls needed credit to settle, and a single failure to settle could have cascaded through the clearing system.
The comparison across countries makes the case. Central banks in the United States, West Germany and Japan supplied liquidity and prevented defaults, and the effect on their real economies was mild and short. New Zealand's central bank declined to ease, and New Zealand suffered a far longer and deeper downturn. Same shock, different policy response, very different outcome.
The recovery nobody expected
The contrast with 1929 is the most striking part of the story. That crash was followed by the Great Depression. This one was followed by very little.
Selling continued into Tuesday morning, and for a stretch the market came close to not functioning at all: the Chicago Mercantile Exchange halted S&P 500 futures around midday and the New York Stock Exchange debated closing. Then buyers appeared. Over 20 and 21 October the Dow regained 288 points (about 57% of Monday's loss), and Tuesday's percentage gain was the largest since 1933.
The full recovery took a little under two years. And the statistic that surprises people most: the Dow finished 1987 up. It opened the year near 1,897 and closed at about 1,939. In between it had reached 2,722 and lost a fifth of its value in a day, and the calendar year was still positive.
Anyone who had bought in January and never looked at a screen would have ended the year slightly ahead, which says something uncomfortable about how much of a crash is experience rather than outcome.
What the crash left behind
Circuit breakers. The clearest legacy. US equity markets now halt when the S&P 500 falls 7% and again at 13%, each for fifteen minutes, and close for the day at 20%; the first two halts apply only before 3:25 p.m. Eastern, the 20% close at any time. The purpose is to interrupt exactly the feedback loop that portfolio insurance created: stop the automatic sellers, let humans look at prices, let buyers organize. They were triggered four times in March 2020.
The volatility smile. This is the legacy traders live with daily and rarely trace to 1987. Before the crash, options were priced roughly as Black-Scholes assumed: the same implied volatility across strikes. Afterward, out-of-the-money puts have permanently traded at a premium to the model, because the market now prices the possibility of a 20% day. That skew has never gone away. Every option chain you look at still carries the memory of Black Monday.
Scrutiny of automated trading. The Brady Commission examined how the mechanics of futures, options and cash markets had interacted, and its findings pushed the exchanges toward coordinated rules. Algorithms today are faster and far more prevalent than in 1987, and the flash crashes since suggest the underlying problem was managed rather than solved.
What it teaches
Crashes do not require a cause. A stretched market, accumulated nervousness and a mechanical amplifier are sufficient. Waiting for an identifiable trigger before taking risk seriously is a way of being late.
Risk tools change behavior, and behavior changes risk. Portfolio insurance worked in backtests because backtests assume you can always sell. When enough participants adopt the same protection, the protection becomes the danger. This applies to stop-loss clusters, volatility targeting and risk parity today for exactly the same reason.
Liquidity is a condition, not a property. The stocks that could not open on 19 October were the largest and most liquid in the world the previous Friday. Liquidity is something a market has until the moment everyone needs it.
The policy response determines the aftermath. 1929 and 1987 were comparable market events with completely different economic consequences, and the difference was what the central bank did in the following week.
The record that still stands
Black Monday remains the worst single day US equities have ever had, and the fact that it happened without a catastrophe attached is the point. It was a market accident: a long rise, a nervous autumn, a bad week, and a set of automated strategies that all pointed the same way.
The crash left behind the circuit breakers that pause modern markets and the option skew that prices modern tail risk. Both exist because on one Monday in October the market discovered that everybody's protection was the same trade, and that a trade everyone is in has nobody to sell to.