Moving averages are probably the most widely used technical indicator in the world. Open any chart on TradingView or MetaTrader and you will find traders using them to identify trends, locate support and resistance, or generate entry and exit signals. But like every technical tool, moving averages have precise limits and will produce false signals when applied in the wrong context.
This article compares the three main types, the SMA (simple moving average), the EMA (exponential moving average) and the WMA (weighted moving average), with concrete examples of when each one makes sense, and when you are simply walking into a ranging market that will grind your account down with whipsaws. If you need the underlying definitions first, the guide to simple, weighted and exponential moving averages covers the basics; this article is about choosing between them.
What a Moving Average Actually Does
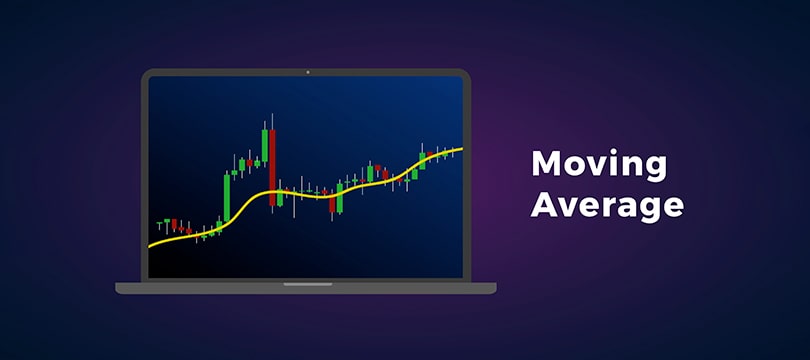
A moving average is simply the average of closing prices calculated over a defined number of periods. A 20-period MA on a daily chart is the average of the last 20 daily closes. The underlying idea is that this smoothed value lets you see the general direction of the market without the noise of daily fluctuation.
When price is above the moving average, the context is generally bullish. When it is below, bearish. Moving averages are also used as dynamic support and resistance: in a strong uptrend, price tends to bounce off the moving average during pullbacks rather than break through it.
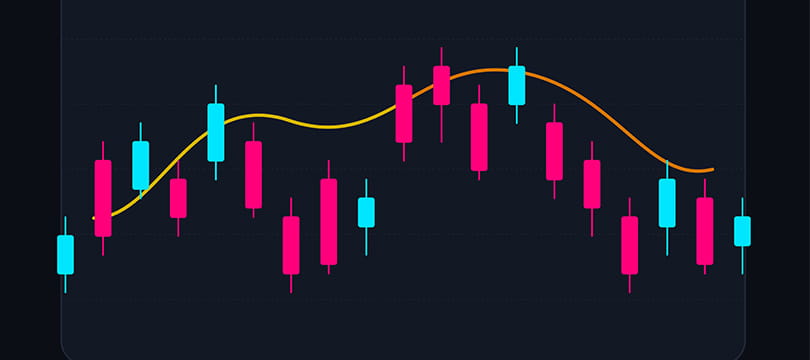
The problem arises when the market has no clear direction. In a sideways range, price crosses the moving average continuously, generating false reversal signals in both directions. This is where a great many beginners lose money: they apply moving average strategies mechanically without first establishing whether the market is actually going anywhere.
The Simple Moving Average (SMA): Easiest and Slowest
The SMA is the most direct calculation: sum the closing prices of the last N periods and divide by N. With a 10-day SMA and closes of 100, 102, 101, 103, 105, 104, 106, 107, 108 and 110, the SMA is 1,046 divided by 10, or 104.6.
The advantage of the SMA is that every price carries equal weight. There is no bias toward recent data, which makes it smoother and less reactive to short-term fluctuation. The flip side is exactly that slowness: when the market changes direction, the SMA takes longer to register the change than averages weighting recent prices more heavily.
The 50 and 200-period SMAs are probably the most closely watched averages in equity markets. The Golden Cross — the 50-day SMA crossing above the 200-day — is treated as a long-term bullish signal. The Death Cross is the inverse: the 50-day crossing below the 200-day, signalling a potential bearish trend.
Be careful with the actual evidence, though. Backtests of Golden Cross and Death Cross systems on US equity indices over the past two decades have generally shown them lagging a simple buy-and-hold approach. The reasons are structural: crossovers arrive after a large part of the move has already happened, and in ranging markets they generate whipsaws that enter and exit at consistently unfavourable prices. That does not make the levels useless as reference points (a great deal of capital watches them), but it does mean trading the crossover mechanically is a weak strategy.
The Exponential Moving Average (EMA): More Responsive, Noisier
The EMA addresses the SMA's slowness by giving more weight to recent prices. The formula is slightly more involved: rather than simply dropping the oldest value and adding the newest, the EMA applies a multiplier that makes today's price count for more than yesterday's, and yesterday's more than the day before.
The multiplier is calculated as 2 / (N + 1), where N is the number of periods. For a 10-period EMA the multiplier is 2 divided by 11, or 0.1818, meaning today's price accounts for roughly 18% of the calculation.
What you get is a line that reacts considerably faster to price change. When the market reverses, the EMA changes slope before the SMA does. That is particularly useful for day traders and swing traders who need timely signals. It also means that in a volatile market you take more false signals, because the EMA moves more even when short-term noise does not indicate a genuine trend change.
The most widely used EMAs in intraday trading are the 9 and the 21. Many scalpers apply them to five-minute charts to identify micro-trends within a session. On daily charts, the 12 and 26-period EMAs form the basis of the MACD, one of the most popular momentum indicators in existence.
The Weighted Moving Average (WMA): The Compromise Nobody Uses
The WMA attempts to sit between the SMA and the EMA. Instead of weighting all prices equally like the SMA, or applying an exponential multiplier like the EMA, the WMA assigns linear weights: the most recent price gets weight N, yesterday N−1, the day before N−2, and so on.
For a 5-period WMA the calculation is: (today's price × 5 + yesterday × 4 + two days ago × 3 + three days ago × 2 + four days ago × 1) divided by (5+4+3+2+1).
The result is a moving average more responsive than the SMA but less jumpy than the EMA. In theory it sounds like the ideal solution. In practice very few traders use it, because it offers no decisive advantage over the other two, and the additional complexity of the calculation (even though your software handles it automatically) does not justify the marginal benefit.
If you want a genuinely different behavior rather than a middle point between two existing options, adaptive averages are a more interesting direction. The article on the adaptive moving average covers an approach that adjusts its own responsiveness to market conditions.
When Moving Averages Work: Strong Trends
Moving averages are trend-following indicators, which means they only work well when there is actually a trend to follow. In a strong uptrend, price stays above the moving average, and every approach to it during a pullback offers a long entry with a stop below the average. In a strong downtrend, price sits below and rallies toward the average become opportunities to short.
A concrete example: EUR/USD through 2022, during the downtrend from 1.2200 to 0.9600. The 50-period EMA on the daily chart acted as almost perfect resistance for months. Every time price rallied toward the EMA 50, it was rejected and continued falling. A trader shorting those rallies with a stop 50 pips above the average would have captured moves of 200 to 400 pips repeatedly.
But it is essential to establish first whether you are in a trend or a range. If you open a chart and see price crossing the moving average back and forth continuously, you are not in a trend. You are in a sideways market, and MA-based strategies will generate nothing but whipsaw losses.
The False Signal Problem in Ranging Markets
This is the structural limitation of moving averages: they work only in trending markets, which as a rule of thumb account for perhaps 30 to 40% of the time in FX and equities. The rest of the time, markets oscillate without clear direction.
When price is in a range, every crossover looks like a reversal signal. Price falls below the MA, it looks like a short signal, you enter short, price immediately rises back above, your stop is hit, price falls below again, it looks like a short signal once more: an endless cycle of losses.
The solution is not to add a dozen more indicators. It is to apply a trend filter before using an MA strategy. A simple method: check whether the highs and lows of price are progressively rising, indicating an uptrend, or progressively falling, indicating a downtrend. If highs and lows oscillate without clear direction, simply do not use trend-following strategies. Wait for a genuine trend to form. The guide to market entry timing covers how to confirm that the wait is over.
Practical Strategies With Moving Averages
A basic approach uses the moving average as dynamic support during an uptrend. When price is above the MA and pulls back toward it, you enter long if price bounces. The stop goes below the MA with a safety buffer of 10 to 20 pips, and the target can be the previous high or a risk-to-reward ratio of at least 1:2.
Another popular strategy is the two-average crossover: one fast, one slow. When the fast MA crosses above the slow one, you enter long. When it crosses below, you exit or enter short. The problem with this approach is lag: by the time you see the crossover, the strong part of the move has frequently already happened and you are entering late.
Many traders combine moving averages with momentum indicators to filter signals. For example: take long signals from the MA only when the RSI is above 50, confirming bullish momentum, and short signals only when it is below 50. This does not eliminate false signals but it reduces them meaningfully.
An approach that works better for many traders is to use moving averages not as an automatic signal system but as visual context. If price is above the 200-period MA on the daily chart, you know you are in a long-term bullish context and look only for long opportunities, ignoring short signals entirely. If below, you do the opposite. The MA becomes a direction filter rather than a mechanical trading system, and this is almost always the more profitable way to use it.
Which Periods Should You Use?
There is no single best period for a moving average. It depends entirely on your trading timeframe. Day traders operating on five to fifteen-minute charts tend to use short averages: EMA 9, 21, 50. Swing traders holding positions for days or weeks use daily averages: SMA or EMA 20, 50, 200. Position traders investing over months look at weekly or monthly averages.
The 200-period MA is probably the most watched of all on daily charts, in both equities and FX. Many funds and institutions use it as a long-term trend reference. When price crosses the 200-period MA you frequently see volume increase, because a large number of automated systems activate at exactly that level.
The 50-period MA is treated as the medium-term trend. The 20-period represents roughly a month of trading and is used for the short term. Some traders build ribbons of moving averages — 8, 13, 21, 34, 55 — to gauge the depth of a trend: if every average is aligned in the same direction without intertwining, the trend is strong.
Common Mistakes With Moving Averages
The number one error is trying to optimize the perfect period through backtesting. You spend weeks testing averages from 10 to 100 periods on historical data and discover that the 37-period average produced the best results. Then you use it in forward testing and it stops working. Why? You have curve-fitted: you found parameters that worked on that specific past dataset with no predictive value going forward. The guide to spotting a fragile trading strategy covers this failure mode in detail.
Another error is using too many moving averages simultaneously. Some traders put five or six on the chart, assuming more signals confirm direction better. The result is an unreadable chart and analysis paralysis: some averages say long, others say short, and you end up doing nothing. Better to use one or two well-chosen ones.
Ignoring market context is the gravest error of all. Moving averages are trend-following tools, so applying them in a range market is practically designed to lose money. Before using any MA-based strategy, do a visual check: is the market trending, with rising or falling highs and lows, or oscillating in a range? If the answer is range, skip the MA strategy entirely.
Which One Should You Actually Use?
The honest answer is that the choice between SMA, EMA and WMA matters far less than the choice of when to use any of them. That said, there is a reasonable default. Use the EMA if your holding period is short and you need the average to turn quickly — intraday and swing trading. Use the SMA if you want a stable reference level that a lot of other market participants are also watching, which is what makes the 200-day SMA useful as a line in the sand rather than as a signal. Skip the WMA unless you have a specific reason to want linear weighting, because it will not change your results in any way you can measure.
The debate about whether moving averages still work is largely beside the point. They were never an infallible system and they still are not. As a tool for visualising trend and identifying dynamic support and resistance, they remain useful. Markets still trend and still range, exactly as they did thirty years ago. What has changed is speed: moves are faster, gaps more frequent, volatility higher. That means traditional averages such as the 50 and 200 may be too slow to capture current trends, particularly in crypto and highly volatile tech equities.
Treat moving averages as a component of your system rather than as the system. Combined with volume analysis, price patterns and volatility filters, they add genuine value. Used alone, with unrealistic expectations of clean signals, they produce frustration and losses.