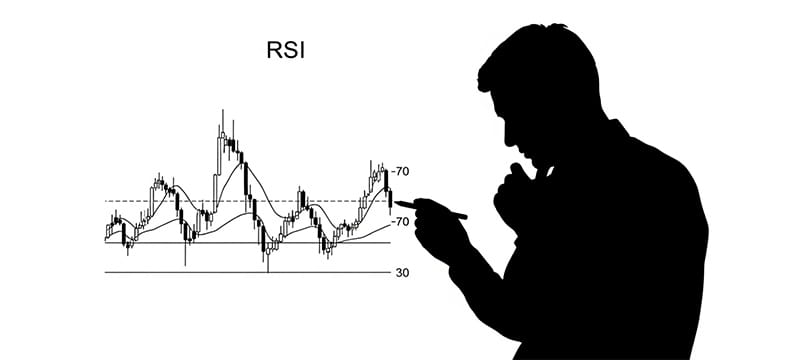
The RSI (Relative Strength Index) is probably the best known momentum indicator after the MACD. Developed by J. Welles Wilder in 1978, the RSI measures the speed and magnitude of price moves in order to identify overbought conditions, when an asset is too high and might fall, and oversold conditions, when it is too low and might rebound.
The problem is that a great many traders use it mechanically. They see the RSI above 70, conclude overbought, time to short, and end up shorting a powerful uptrend that continues climbing for weeks with the RSI parked above 80. This article covers how the RSI actually works, when the classic signals are reliable, and when they should be ignored entirely.
How the RSI Is Calculated: Wilder's Formula
The RSI oscillates between 0 and 100 and is based on the relationship between up periods, where the close is higher than the previous one, and down periods, where it is lower, measured over a lookback window, conventionally 14 periods. Wilder's formula is:
RSI = 100 − (100 / (1 + RS)), where RS = average gain / average loss
The exact calculation requires tracking gains and losses separately across the 14 periods. If EUR/USD rises from 1.1000 to 1.1020, the gain is 20 pips. If the next day it falls to 1.1010, the loss is 10 pips. After 14 periods you calculate the average gain and the average loss, divide one by the other to obtain RS, then apply the formula to get the final RSI value.
What distinguishes Wilder's RSI is that it uses exponential smoothing. After the first 14 periods, the new average gain is calculated as (previous average × 13 + new gain) / 14. That makes the RSI less reactive to individual price spikes than a simple arithmetic calculation would be. It is also why two platforms can display slightly different RSI values if one of them uses a simple average instead.
The Key Levels: 70, 30 and the Neutral Zone at 50
Standard theory says: RSI above 70 indicates an overbought condition and a probability of downward correction, RSI below 30 indicates an oversold condition and a probability of an upward bounce, and RSI around 50 is neutral with no clear directional pressure. Those levels work well in markets oscillating within a range without a strong trend.
During a strong trend, though, the RSI can stay in overbought or oversold territory for weeks at a time. Through the Bitcoin rally of 2020 and 2021, the daily RSI remained above 70 for months on end. Anyone shorting because the RSI was above 70 would have lost an enormous amount of money while Bitcoin traveled from around $10,000 to above $60,000.
The practical rule: during a strong uptrend, the RSI rarely falls below 30 and often stays between 40 and 90. During a strong downtrend, it rarely rises above 70 and oscillates between 10 and 60. Using 70 and 30 as reversal signals during a strong trend is the single most common error that leads to losses with this indicator.
RSI Divergences: When Price Lies and the RSI Tells the Truth
Divergences are the most powerful signal the RSI can give. A bullish divergence forms when price makes a new lower low but the RSI makes a higher low. That suggests that although price is still falling, bearish momentum is weakening and a reversal may be approaching.
An example: EUR/USD falls from 1.1000 to 1.0900 with the RSI dropping to 25. It then recovers to 1.0950 and falls again to 1.0880, a new low, but this time the RSI only falls to 32, a higher low than before. That bullish divergence suggests sellers are losing force and a meaningful bounce may follow.
Bearish divergences work the other way: price makes a new higher high but the RSI makes a lower high. That indicates that although price is still rising, bullish momentum is fading. Divergences do not tell you exactly when the reversal will occur, but they warn you that the current trend is losing strength. They are particularly useful as a confirming filter on reversal formations such as the double top and double bottom, where a divergence on the second peak substantially improves the odds.
Trending Markets Versus Ranging Markets
The fundamental distinction: in a range-bound market, the 70 and 30 levels work well as reversal signals. Price oscillates between support and resistance, and when the RSI reaches 70 near resistance, a downward bounce is likely. When it reaches 30 near support, an upward bounce is likely.
In a trending market you have to use the RSI in a completely different way. In an uptrend, look for pullbacks when the RSI falls toward 40 to 50 — not toward 30. When the RSI bounces from those levels, it signals that the pullback is over and the trend is resuming. In a downtrend, look for rallies when the RSI rises toward 50 to 60, and consider shorts when it turns back down from there.
A practical technique: draw a trendline on the RSI itself. During an uptrend, the RSI forms rising lows — 40, 45, 50. When the RSI breaks that trendline to the downside, it can be the first indication that the uptrend is weakening, frequently before the same signal appears on price. The reverse applies during a downtrend.
Trading Strategies With the RSI
The simplest strategy for ranging markets: buy when the RSI falls below 30 and starts to turn up, place the stop below the recent low, and target either an RSI of 70 or the resistance of the range. Sell when the RSI rises above 70 and starts to turn down, with the stop above the recent high and the target at an RSI of 30 or the support of the range. This strategy gets comprehensively destroyed the moment the market breaks out of the range and starts trending.
For trends, a better approach: identify the trend using a moving average — for example, price above the 200-period MA equals an uptrend. In the uptrend, buy only when the RSI pulls back below 50 and then rises back above it. In the downtrend, short only when the RSI rallies above 50 and then falls back below. This aligns you with the trend instead of fighting it, and the comparison of SMA, EMA and WMA covers how to choose the average you filter with.
Many traders combine the RSI with other indicators. A popular setup pairs it with Bollinger Bands: when price touches the lower band and the RSI is below 30, you have double confirmation of an oversold condition. When price touches the upper band and the RSI is above 70, you have double confirmation of overbought. Combined signals are generally more reliable than single ones — with the caveat that both of those indicators measure closely related things, so the confirmation is less independent than it looks.
The RSI on Crypto: Different Levels for Extreme Volatility
Crypto markets are considerably more volatile than FX or equities, and that calls for adjustments to the standard RSI levels. Many crypto traders use 80 and 20 instead of 70 and 30 as overbought and oversold thresholds, because with extreme volatility the RSI can easily stay between 30 and 70 even during very violent moves.
During crypto bull markets the RSI can stay above 70 for months. Bitcoin held its weekly RSI above 70 from September through December 2017. Ethereum did the same from January to April 2021. Shorting because the RSI was high during those periods would have been disastrous.
A better approach for crypto: use the RSI to time entries within the trend, not to try to call tops and bottoms. If the trend is up, wait for the RSI to fall to 40 or 50 during a pullback and buy there. Do not try to short at an RSI of 80 hoping for a reversal that may not arrive for months.
Common Mistakes With the RSI
The gravest error is shorting an uptrend purely because the RSI is above 70. Through the 2020 and 2021 rally in tech equities and crypto, traders lost money for months by continuing to short because the RSI was extremely high while price kept climbing. The RSI is telling you momentum is strong, not that a reversal is imminent.
Another common error is continually changing the RSI parameters. Some traders test the RSI at 5, 9, 14, 21 and 30 periods looking for the one that works best. The result is curve fitting: they find parameters that worked on past data and have no predictive value going forward. Better to stay with Wilder's standard 14 periods and learn to use them properly. The guide to spotting a fragile trading strategy covers why this particular habit is so corrosive.
Ignoring market context is a third serious problem. The RSI does not behave the same way across all markets. In equities during earnings season, the RSI can give entirely unreliable signals because moves are driven by company-specific news rather than by technical momentum. In those cases it is better to wait for volatility to settle before relying on it. The same applies around major macroeconomic releases in FX.
The RSI as a Trend Filter, Not a Standalone System
The reality is that the RSI works best as a filter inside a broader system rather than as a standalone trading system. If you use it as your only indicator for deciding when to buy and sell, you will frequently find yourself on the wrong side of the dominant trend.
A more robust approach: use a moving average, or an analysis of highs and lows, to identify the trend. Then use the RSI for better entry timing. For example: price above the 200-period MA establishes a bullish context. You wait for a pullback where the RSI falls below 50. When the RSI recovers above 50, you buy. The stop goes below the low of the pullback, and the target is the next resistance or a trailing stop.
Used this way, the RSI does not put you in conflict with the trend. It helps you enter during moments of temporary weakness inside the primary move. That is an enormous difference from using the RSI to try to call reversals against the dominant trend — which is the fastest route to losing money with an otherwise excellent indicator. For the broader question of when a signal is genuinely tradable, see the guide to market entry timing.