It happens to every trader sooner or later. You open a position, place the stop loss just below an obvious support, and the price walks straight down to your stop, throws you out, then turns and runs exactly the way you had predicted. The feeling is unmistakable: someone came for your stop. The phenomenon has a name, stop hunting, and it is one of the most discussed and most myth-laden subjects in retail trading.
The question everyone asks is whether it is real. Does somebody see your stop and deliberately go and take it? The honest answer is more nuanced than yes or no, and understanding the difference is what separates a trader who learns to manage the phenomenon from one who develops a paranoid and self-defeating mindset. This guide separates what is genuinely real, and a large part of it is, from what is legend. It explains the liquidity mechanics behind the pattern and shows how to place stops so that you are not the easiest target on the chart.
Two very different claims wear the same label
Before anything else the terms need sorting, because two very different ideas travel under the heading of stop hunting. The first is: your broker sees your stop loss and moves the price on purpose to trigger it. The second is: large market participants know where retail stops statistically cluster and push price toward those areas to use the liquidity sitting there. These are radically different statements and they have different answers.
The first version, the broker personally hunting your stop, is a myth in the overwhelming majority of cases, at least where serious regulated brokers on major markets are concerned. The second version, price being drawn toward pools of liquidity, describes a real and well documented dynamic of how markets work, though it functions in a less personal way than most traders imagine.
Telling the two apart matters, because the first leads to useless conclusions such as trading being rigged against you, while the second leads to useful ones: work out where liquidity accumulates and stop placing your protection in the most predictable spot on the chart.
The myth: your broker coming for your stop
Start with the conspiracy version. On regulated centralized markets, such as futures or equities, price forms on an exchange through millions of buy and sell orders from all over the world. No broker has the power to move a market like that in order to reach one retail client's stop. The price of an S&P 500 future or of gold is not set by your intermediary; it is set by the global market. In that context the idea that someone moves the market for you simply does not hold: your position is a drop in an ocean.
The picture is slightly different in the world of CFDs and over-the-counter forex, where the broker can be the direct counterparty to the client's trades and quotes its own prices. There, in theory, a dishonest intermediary would have the technical ability to manipulate its own quotes, and the industry has seen brokers sanctioned by regulators for unfair practices of various kinds. But honesty cuts both ways: for a broker regulated in a major jurisdiction, systematically manipulating prices against clients would mean risking the license, and therefore the whole business, for marginal gains. Serious brokers price off their liquidity providers, and supervisors compare quotes. The best defense here is not paranoia but a mundane choice: use solid regulated brokers and avoid opaque intermediaries based in regulatory havens.
There is also a psychological factor that inflates the perception enormously, and it is selective memory. Traders remember vividly every time the stop was taken to the pip before a reversal, and forget every time the stop saved them from a far worse loss, or every time price stalled before reaching it. The feeling that it always happens to me is, in large part, a statistical illusion fed by frustration.
The reality: stops are pools of liquidity
Now the part that is true, and it is the more interesting half. Markets run on liquidity: to buy in size you need someone selling, and vice versa. A fund or a large operator building a significant position has a concrete problem. Buying aggressively into a quiet market pushes price against itself. What it needs is an area where plenty of liquidity is available, meaning plenty of orders ready to be filled.
And where do orders cluster, predictably and systematically? Exactly where the textbooks teach traders to put them: just below obvious supports, just above obvious resistances, under recent lows, over recent highs, around round numbers. A stop loss on a long position is technically a resting sell order; a stop on a short is a resting buy order. When price reaches an area dense with stops, all those orders fire together and create a sudden wave of liquidity.
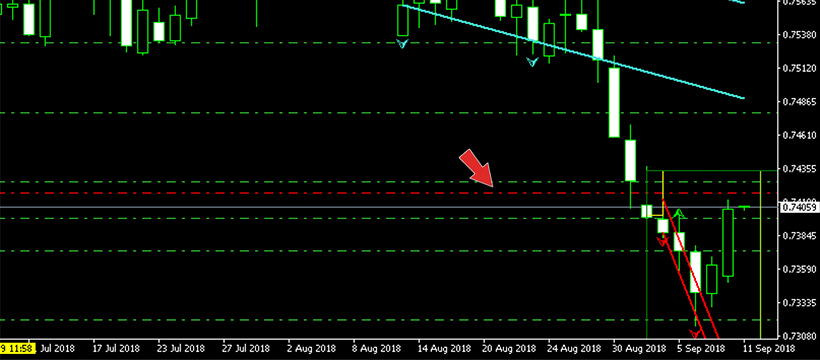
That is why price seems drawn to certain levels. When the market dips just under an obvious low, the stops of the longs trigger as forced selling, and that selling is precisely the liquidity a large buyer needs to fill orders at a decent price. The visual result is the pattern every trader recognizes: a quick spike below support, the liquidity absorbed, and a move back the other way. The jargon calls it a liquidity sweep or a stop run. Nobody needs to see your specific stop; it is enough for large participants to know, from experience and logic, that thousands of stops sit below that low because thousands of traders reason the same way. The article on institutional liquidity hunting tactics goes deeper into how those participants operate.
So this is the version of stop hunting that genuinely exists: not a conspiracy against an individual, but a structural feature of markets in which price tends to visit liquidity, and liquidity happens to sit where retail traders place their stops en masse. Your stop is not taken because it is yours. It is taken because it is in the same place as everybody else's.
Where the legal line actually runs
It is worth being precise about the legal boundary, because pushing price toward liquidity and manipulating a market are not the same thing. Buying or selling aggressively with real orders, even in the knowledge that this will trigger stops, is legitimate market activity. Large participants are entitled to execute their strategies, and seeking liquidity is part of the game.
A different matter is conduct such as spoofing, meaning placing large orders with no intention of executing them, purely to create a false impression of supply or demand and move price, then canceling them. That is illegal on regulated markets, and supervisors including the CFTC and the SEC in the United States have pursued it with heavy penalties, criminal convictions for individual traders and fines running into the hundreds of millions of dollars for major institutions over manipulation in futures markets. So yes, manipulation exists, gets discovered and gets punished. But it is a specific category of conduct, not the universal explanation for every stop that gets taken.
For a retail trader the practical conclusion is this: the move that takes your stop below an obvious low is almost always legitimate liquidity dynamics rather than a crime committed against you. Treating it as a market characteristic to understand and manage is productive. Treating it as personal persecution is the road to progressively worse decisions.
How to spot the areas at risk of a stop run
If the phenomenon is structural then it is also, in part, predictable. The zones where stop liquidity accumulates can be recognized with a little practice. Obvious highs and lows, the ones anybody spots at a glance, are the prime candidates: the more obvious a level, the more stops rest on it, and the more likely price is to visit it eventually. The same goes for round numbers, for the previous day's high and low, and for levels touched repeatedly that every textbook calls strong. If you would rather not eyeball them, the high-probability zones page lists the levels where several factors line up, with the distance from the current price, and the support and resistance page shows the nearest levels pair by pair.
One classic pattern to learn is the false break with a snap back: price breaks an obvious level, stops trigger along with the breakout orders of traders chasing the move, but there is no follow-through, and shortly afterward price returns decisively inside the previous range. That break was not the start of a trend, it was a liquidity collection. Many experienced traders have learned not only to avoid being caught by these moves but to use them as signals, entering against the false break once the return is confirmed, with the stop beyond the extreme of the spike. The guide to identifying and avoiding false breakouts covers the confirmation criteria in detail.
Beware the opposite excess, though. Not every break is false and not every move toward a low is a stop hunt. Real breakouts exist, and supports sometimes give way because the market genuinely is changing direction. Reading liquidity zones is a piece of context, not a crystal ball, and it has to be combined with the trend, with volume where it is available, and with how price behaves after the break.
Placing stops so you are not the easy target
Now the practical part. The first rule is to stop placing protection in the most obvious spot on the chart. If your stop sits one pip below the low everybody can see, you are inside the liquidity pool the market tends to visit. Give the stop room, placing it beyond the liquidity zone rather than just inside it: a little further than the obvious level, past the area where a liquidity spike typically exhausts itself. A useful tool for calibrating that distance is volatility, for example using the Average True Range to size stops in proportion to an instrument's normal noise instead of using arbitrary fixed distances. The volatility page publishes real ATR readings per pair on several timeframes, and position sizing with ATR explains how to turn those numbers into a size.
One crucial point: widening the stop does not mean risking more. It means reducing position size in proportion, so that the maximum loss in money stays identical, for instance always one percent of capital. A wider stop with a smaller position survives the liquidity spikes that a tight stop with a large position cannot. It is one of the most important trade-offs to internalise: better to be right with a smaller position than almost right with a big one and thrown out by noise.
The second rule concerns timing. Liquidity spikes are more frequent when the market is thin, such as overnight sessions or the minutes around major news, when relatively small orders are enough to drag price into the stop zones. Opening a position, or holding tight stops, precisely in those windows means maximum exposure to whipsaw. The third rule, for the more experienced, is to flip the perspective entirely: instead of buying at support with the stop just underneath, wait for the possible spike below support to happen and exhaust itself, then enter after the snap back with the stop beyond the extreme just formed. Handled that way the liquidity dynamic stops being an enemy and becomes part of the plan.
The worst mistake is the victim mindset
Finish with the psychology, because this is where stop hunting does damage well beyond the loss on any individual trade. A trader who becomes convinced of being personally persecuted by the market or the broker almost inevitably develops self-destructive habits: removing stops altogether on the grounds that they get taken anyway, trading without protection, widening losses in the hope of a recovery. That is a direct route to disaster and far more dangerous than any stop run.
The liberating truth is that the market has nothing against you, for the simple reason that it does not know you exist. Your position is invisible in the ocean of transactions. What the market does, it does to the whole mass of traders who behave identically and predictably: the same textbooks, the same levels, the same stops in the same places. The answer is not to remove the protection but to stop being predictable. That means stops calibrated to volatility and placed beyond the obvious zones, size reduced accordingly, and entries that take liquidity dynamics into account. It also means accepting that the occasional stop taken by a hair is part of the statistical cost of the job.
It exists, but not the way you think
So, does stop hunting exist? The honest answer has two halves. The conspiracy version, with the broker or with them watching your stop and moving the market to reach it, is a myth in the vast majority of cases, fed by selective memory and, occasionally, by dishonest intermediaries that decent regulation lets you avoid. The structural version is entirely real: retail stops cluster in predictable areas, those areas are pools of liquidity, and price tends to visit them because large participants need that liquidity to execute. No persecution, just market mechanics. For the mechanics of protection at the level of the individual trade, the earlier piece on stop hunts and how to protect yourself remains the practical companion to this one.
For a trader that distinction changes everything. The myth leads to paranoia and to removing protection; understanding the mechanics leads to adapting, with less obvious stops sized to volatility, position size consistent with wider stops, and false breaks read as signals rather than traps. The market will keep collecting liquidity wherever traders leave it piled up in plain sight. The only choice is whether to keep leaving yours where everybody else leaves theirs, or to learn not to be the easiest target on the chart.