The honest answer to where to place stop loss orders in forex is a geometric one: beyond the level that would prove the idea wrong, with a small buffer for the wicks, and never closer to the entry than the market's normal noise, which is measured with the Average True Range. A stop inside the noise gets hit by a random tick; a stop two daily ranges away turns the trade into a bet that has to be right most of the time just to break even. This article walks through both methods, structural and volatility-based, and then through the exact rule the AI Daily Forecast applies to every plan it publishes. It is a companion piece to the MT5 trade panel guide, which covers the tools that attach the stop for you.
What a Stop Is For
A stop loss is not a number picked to keep the loss small. It is the price at which the reason for the trade no longer holds. A long taken because a support held is wrong once price trades convincingly below that support; the stop belongs there, not at a round number of pips that feels comfortable. Everything else follows from that placement: the distance between the entry and the stop is the risk per lot, and the lot size is what you scale to keep that risk at the share of the account you have decided to expose. Traders who pick the stop first and the level second usually end up with a stop that is either inside the noise or on the wrong side of the structure.
Two families of placement do the job well, and the best plans use both: a structural stop, which reads the chart, and a volatility stop, which reads the pair's recent range. When the two disagree, the distance between them tells you something about the setup.
Structural Stops: Beyond the Level, With a Buffer
The structural stop sits on the far side of the level that justifies the trade. For a long from a support, that is below the support; for a short from a resistance, above it. The support and resistance page lists up to three levels on each side of the price for every market, nearest first, and any of them can play this role, provided it is on the correct side of the entry.
The detail that separates a stop that works from one that does not is the buffer. Levels are zones, not lines, and price routinely pokes a few pips through a support before turning. A stop placed exactly on the level is the first order the market finds; one placed a few pips beyond it survives the wick. The width of the buffer depends on the pair and on the spread: a few pips on a major, more on a cross with a wider spread. Trade panels usually expose this as a setting; in the ForexSentiment panel it is the "Auto SL buffer", the extra distance beyond the S/R level so a wick on the level is less likely to stop you out, and the order form lets you pick which of the three levels the stop rests on.
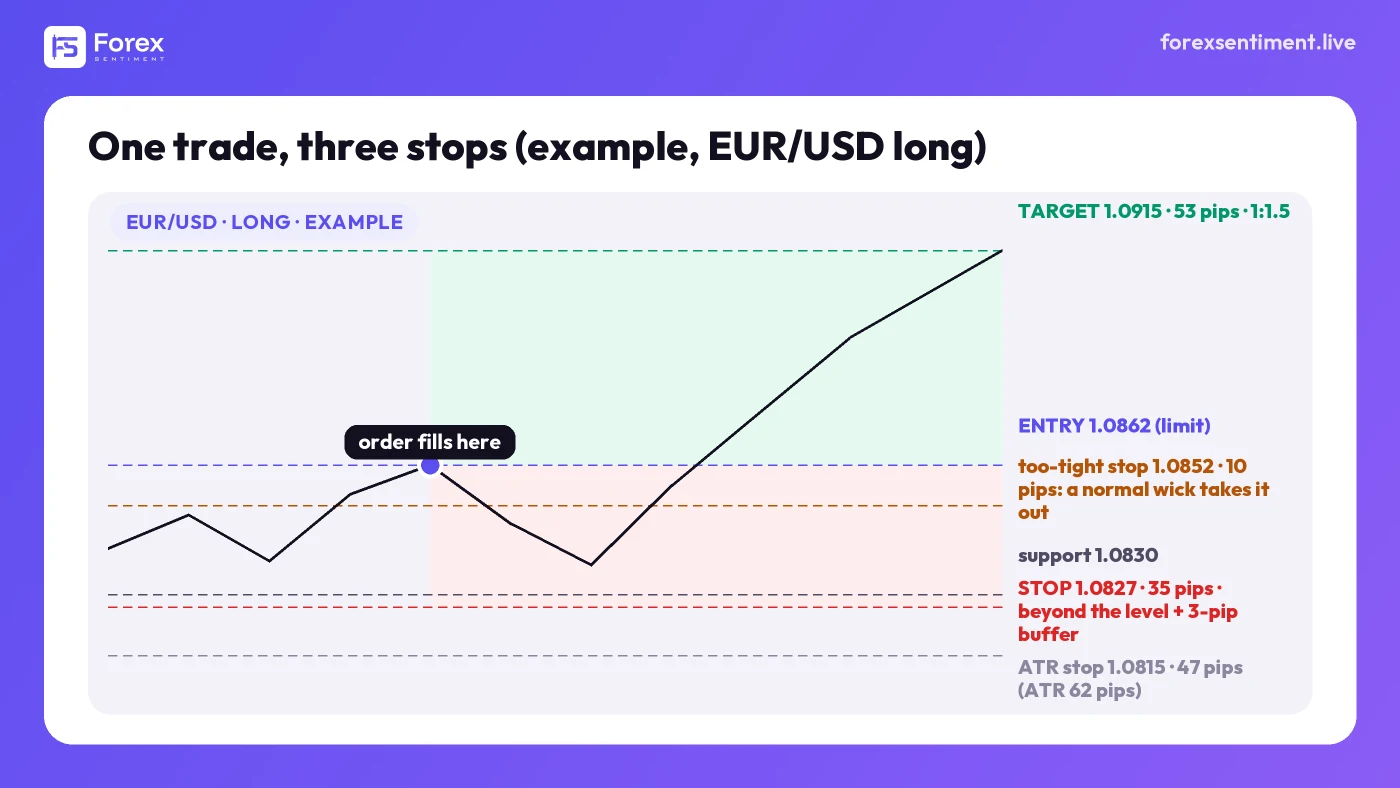
An example, not a plan: a long at 1.0862 with the support at 1.0830. The structural stop sits 3 pips under the level (1.0827, 35 pips, 0.56 ATR); a 0.75 ATR volatility stop would sit at 1.0815; a 10-pip stop at 1.0852 sits inside the noise. Target at the next level, 1.0915.
Take the example in the figure. EUR/USD is bought at 1.0862 against a support at 1.0830, with a 3-pip buffer: the stop goes to 1.0827, a risk of 35 pips. The nearest resistance above is 1.0915, 53 pips away, so the trade offers about 1.5 units of reward for each unit of risk. Every number here is illustrative; the point is the procedure, which is the same on any pair and any timeframe.
Volatility Stops: Measuring the Noise With ATR
The Average True Range over 14 daily candles, ATR(14), is the pair's typical daily travel. It is the yardstick that says whether a stop distance is reasonable regardless of where the levels are. The volatility page publishes it for every market on three timeframes, together with where today's value sits against the recent past.
For a plan meant to last one session, a stop between half an ATR and one full ATR is the standard choice. Below about half an ATR (the nightly rule draws the line at 0.45) the stop sits inside the range the pair covers on an ordinary quiet day, and it is hit by movement that carries no information. Above 2 ATR the stop is so far that the target needed to pay for it is rarely reachable within the same session. In the example above, with a daily ATR of 62 pips, the 35-pip structural stop is 0.56 ATR, comfortably in the band. Had the support been 1.0790 instead, 72 pips away, the structural stop would be 1.2 ATR: legitimate, but a sign that the level is far. A volatility stop of, say, 0.75 ATR (47 pips, at 1.0815) might then be the better anchor, at the cost of sitting inside the structure.
The two methods are therefore not rivals. The structure tells you where the idea fails; the ATR tells you whether that distance is affordable. When the level is within an ATR, use the level with a buffer. When it is beyond, use a volatility stop and accept that a spike through it does not necessarily mean the level failed.
Too Tight, Too Wide, and the Arithmetic Between Them
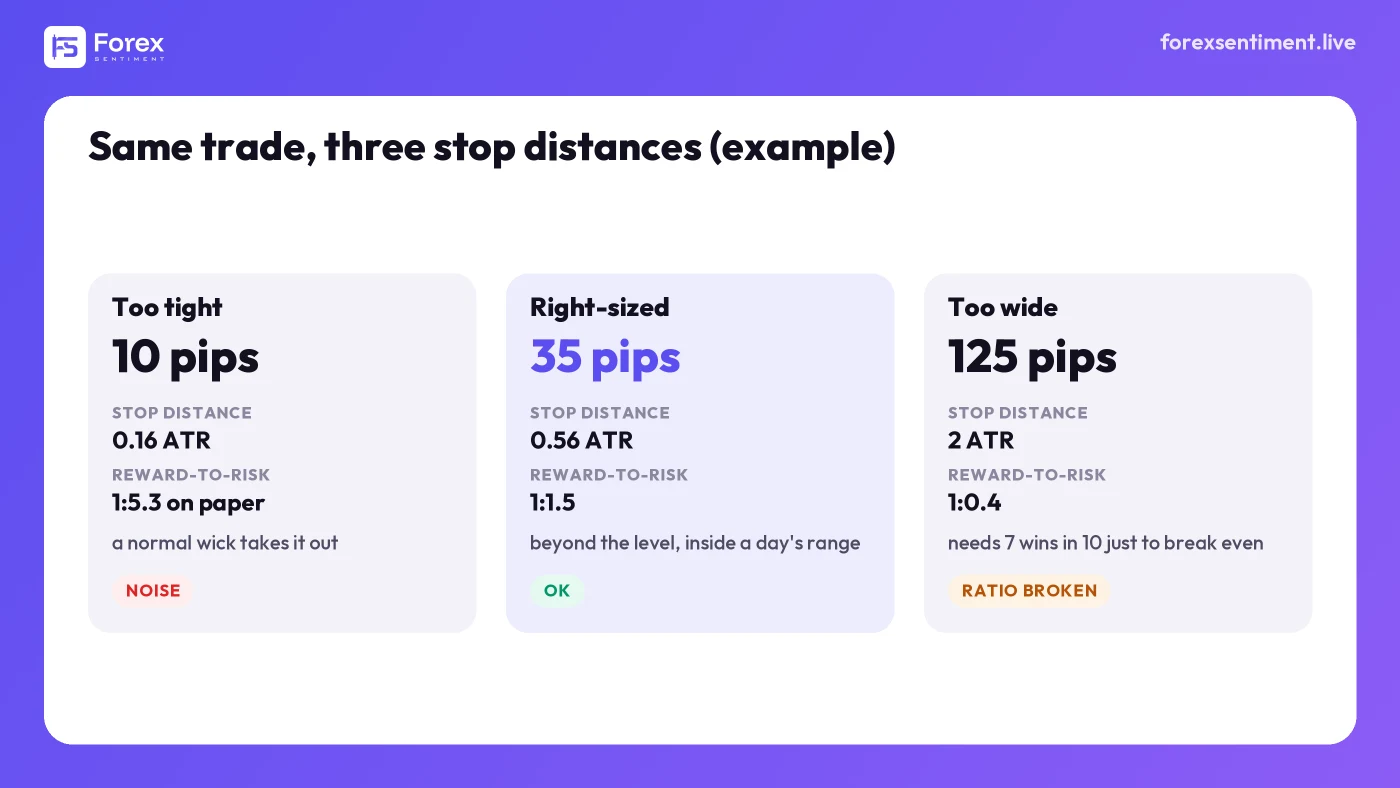
The same entry and the same 53-pip target with three stop distances. The tight one is hit by noise, the wide one turns the reward-to-risk upside down; the one beyond the level, inside a normal day's range, is the only one that keeps both.
The tight stop is seductive because the reward-to-risk looks spectacular: a 10-pip stop against a 53-pip target reads as 1:5.3. It is a fiction. A 10-pip stop on EUR/USD, at 1.0852 in the example, is 0.16 ATR, a distance the pair covers within an ordinary hour of London or New York trading, so the ratio is paid for with a stop that is hit far more often than the target is reached. There is an earlier article on this site about stops that are too tight; the yardstick this one adds is the ATR, and the conclusion is blunt: if the stop is closer than the noise, it is not a stop; it is a fee.
The wide stop fails on the other side. Push the stop to 125 pips, about 2 ATR, against the same 53-pip target and the ratio becomes 1:0.4. In a two-outcome bet, the win rate needed to break even is 1 divided by 1 plus the reward-to-risk: at 1:0.4 that is about 71%, seven wins in ten just to stand still. Nothing in a one-day plan on a major pair earns that.
The right-sized stop is the boring one in the middle: beyond the level, inside the day's range, with a target that offers at least as much as it risks. It will still be hit, often, and that is fine. Its job is to lose the planned amount when the idea is wrong, not to avoid losing.
The Rule Published Every Night
Every trading evening, Sunday to Thursday, the AI Daily Forecast publishes a plan for the markets the model reads as directional, and each plan passes a set of geometry checks before it goes out. They are the same ideas as above, written as numbers, and they are worth knowing because they are also the numbers the trade panel places on the chart.
- The entry is a limit order that waits between 0.05 and 0.20 ATR from the price at the time the plan is written. Closer than 0.05 ATR it is a market order in disguise; farther than 0.20 ATR too many orders would simply never fill.
- The stop must be at least 0.45 ATR from the entry and no more than 2 ATR. Under 0.45 the stop is noise; over 2 a one-session plan cannot pay for it. When the model's own stop falls outside the band, the plan is rebuilt on the analysis levels, with the stop resting beyond the level that protects the trade.
- The target is the first real level worth at least as much as the risk, searched within 2 ATR of the entry. If no such level exists, the pair is published as Neutral rather than with a plan that risks more than it can win.
- The whole geometry is frozen at publication, and the outcome is checked on the real candles of the session and republished, target or stop or expired, whichever happened. The stop is not moved to make the record look better.
The consequence for anyone reading the plan is that the stop distance is never arbitrary: either a level with a buffer or a volatility stop, in both cases bounded by the pair's ATR and priced into a target that must clear 1:1. Reading a plan's stop against the pair's ATR on the volatility page is a good habit: the rule keeps it between 0.45 and 2 ATR, and the band above says where inside that range a one-session stop belongs.
From the Stop to the Lot Size
Once the stop is placed, the lot size is arithmetic. Decide the share of the account to risk on one trade, multiply it by the equity, and divide by the stop distance in money per lot. With a 35-pip stop and a risk budget of one percent on a 10,000 account, the position is sized so that 35 pips cost 100 in the account currency: about 0.28 standard lots on EUR/USD (0.2857 exactly, rounded down to the broker's 0.01 step so the risk stays inside the budget). Move the stop to 70 pips and the lot halves, which is the entire point: the stop sets the size, not the other way around. The article on ATR-based position sizing gives the ATR-based formula, and a trade panel does it at the moment of the click, which is one of the five jobs the trade panel guide lists. A lot size calculator does the division for you, and rounds the lot down.
After the Stop Is Placed
Placing the stop is the last decision that belongs to analysis; everything after the fill belongs to management, and that is a different discipline with its own traps, from moving the stop to breakeven too early to widening it when price approaches. The next article in this series, on forex trade management after entry, covers breakeven, trailing, partial closes and the daily rollover, and when the best management is none at all.
How This Article Was Made
The structural and volatility methods are standard practice; the numbers in the examples are illustrative and not a plan for any date. The limit-order entry, the 1:1 floor and the three outcomes are documented on the Daily Forecast page; the ATR bands are the ones its validation code applies. All of it is geometry, not a promise of outcome. Trading involves substantial risk of loss and is not suitable for every investor: a well-placed stop decides how much a wrong idea costs, not whether the idea was right.