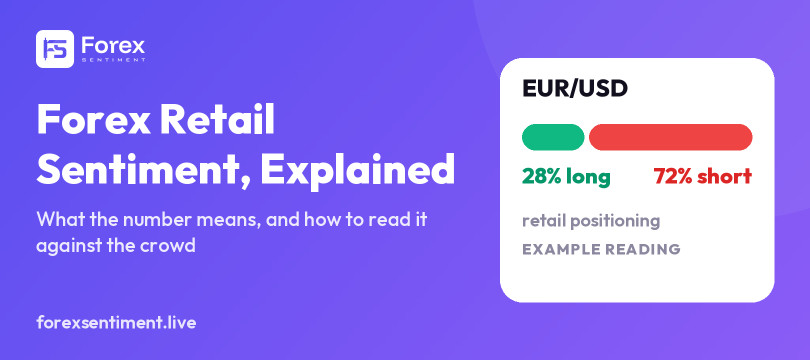
Forex retail sentiment is the share of retail traders holding a long position against the share holding a short one, per market: a bar that reads, say, 28% long and 72% short on EUR/USD. On ForexSentiment.live the number covers 29 markets, is a blended estimate rather than a single broker's book, refreshes about every three hours on weekdays, and is read against the crowd: the more one-sided the book, the more it counts, and it counts on the opposite side. This article explains what the number is, what it is not, how the reading is weighted, and where it shows up, from the homepage cards to the Sentiment tab of the MT5 panel described in the full MT5 trade panel guide.
What the Number Is, and What It Is Not
Every card on the site carries two figures that add up to 100: the percentage of retail traders long and the percentage short on that market. The dominant side is the big number. On a card that says 72% short, most of the retail book on that pair is positioned for a fall. The same bar, with the same two numbers, is the first thing the MetaTrader 5 panel shows for each market, with a chip that reads Balanced, Crowded or Extreme; the screen-by-screen walkthrough of the trade panel shows where it sits and what the other tabs add.
The figure is a blended estimate. Roughly two-thirds of it comes from real retail positions and one-third from a model that infers retail positioning from price behavior. The two are combined with fixed weights, and the same blended number is used everywhere the site shows sentiment: the cards, the pair pages, the signal engine, the app and the panel. That matters because every surface reads the same figure: the analyst comment on a pair page comes from the same refresh as the header above it, and where a text is older than the header, as the evening plan can be, the page prints the time it was written.
It refreshes about every three hours on weekdays, and every reading carries its time. Three things it is not:
- Not a ticking feed. A reading is a snapshot with a timestamp, not a feed that moves as you watch. Between two refreshes the number does not change, and the timestamp next to it says when it last did.
- Not a count of traders. The percentages describe positioning, not how many people hold it. ForexSentiment publishes no trader counts, because a blended estimate has no honest way to produce one.
- Not a forecast. A crowded book tells you where the crowd already is. What the price does next is a separate question, and the site treats it as one.
How to Read One Row
Take the example reading used throughout this article, chosen because it is easy to picture rather than because it is today's number: 28% of retail traders long, 72% short. The bar splits green and red in those proportions; the big figure is the dominant side, "72% short"; under it sits the change over the window you chose. In the panel it is the change of the long share, so "21D +6" means six points more long than at the start of a 21-day window; on the pair pages the chip shows the dominant side and its own change, so "Short 72%" with a fall of 6 points over 21 days means the short share stood at 78% when the window opened.
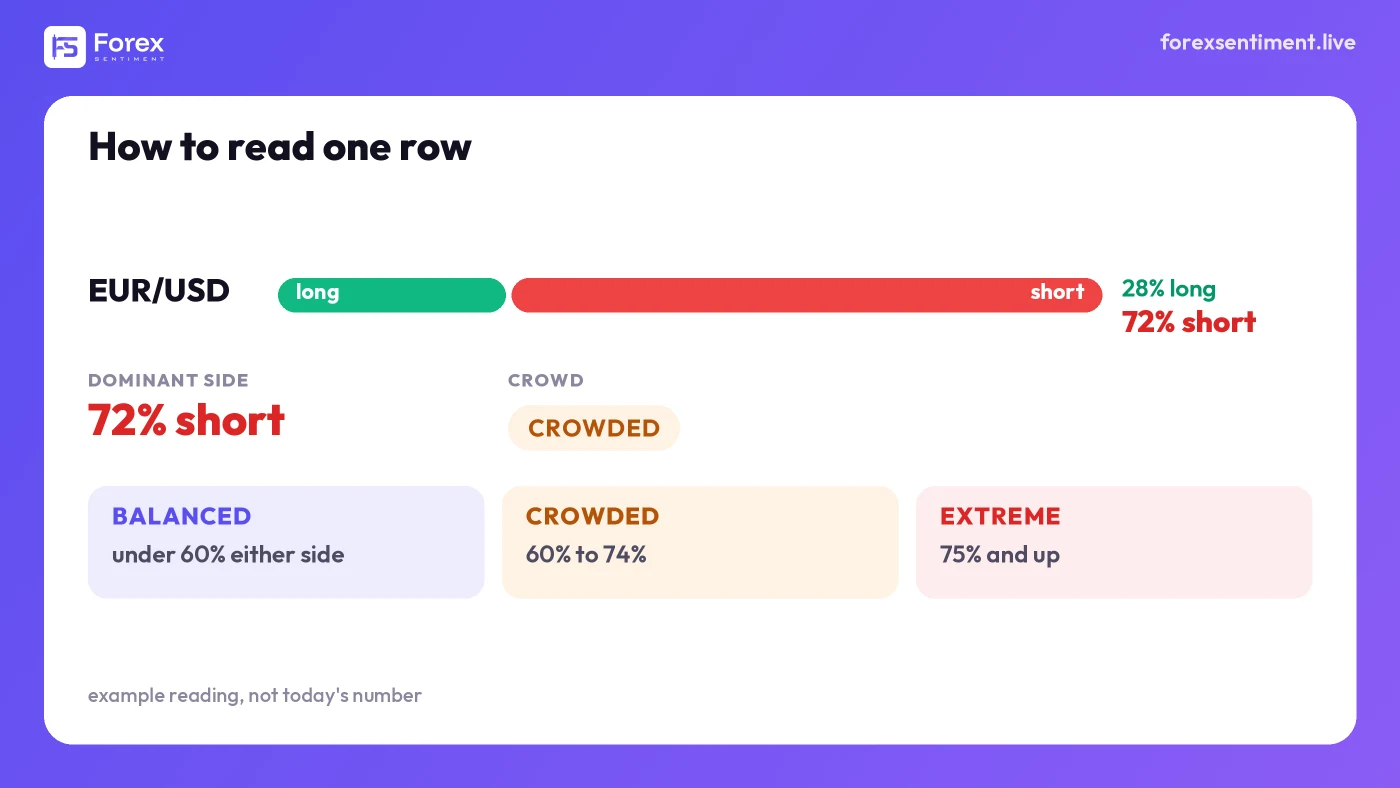
An example reading: 28% of retail traders long, 72% short. The dominant side is the big figure, and 72% falls in the Crowded band (60% to 74%); Extreme starts at 75%.
Next to the bar the panel adds a crowd band, and the homepage explains the same thresholds in words:
- Balanced: under 60% on either side. The book has no clear majority and the number carries little information.
- Crowded: from 60% up to 74%. A majority worth noticing; on the homepage a long share above 60% is called bullish sentiment and a short share above 60% bearish.
- Extreme: 75% and up. The homepage calls readings above 75% a crowded trade with reversal potential; the panel labels them Extreme.
The example above, 72% short, sits in the Crowded band. Three points more and it would be Extreme.
Why the Crowd Is Read Against Itself
Retail traders, taken as a group, tend to fade moves: they buy what has fallen and sell what has risen, and they add to the position as it goes against them. A book that is 80% long is therefore rarely a crowd that just caught a rally; more often it is a crowd that has been buying a decline. That is the whole basis of the contrarian reading: an extreme on one side counts against that side.
The signal engine on ForexSentiment.live applies exactly this logic, and it does so with a ramp rather than a switch. Up to a 60/40 split the sentiment factor is worth nothing. From there its weight rises in proportion to the imbalance: half weight at 75/25, full weight at 90/10, always pointed against the dominant side. In plain arithmetic, the weight is the distance of the dominant share from 50, minus 10 points, divided by 30, and floored at zero, so a 65/35 book counts one sixth, a 75/25 book one half, and a 90/10 book in full.
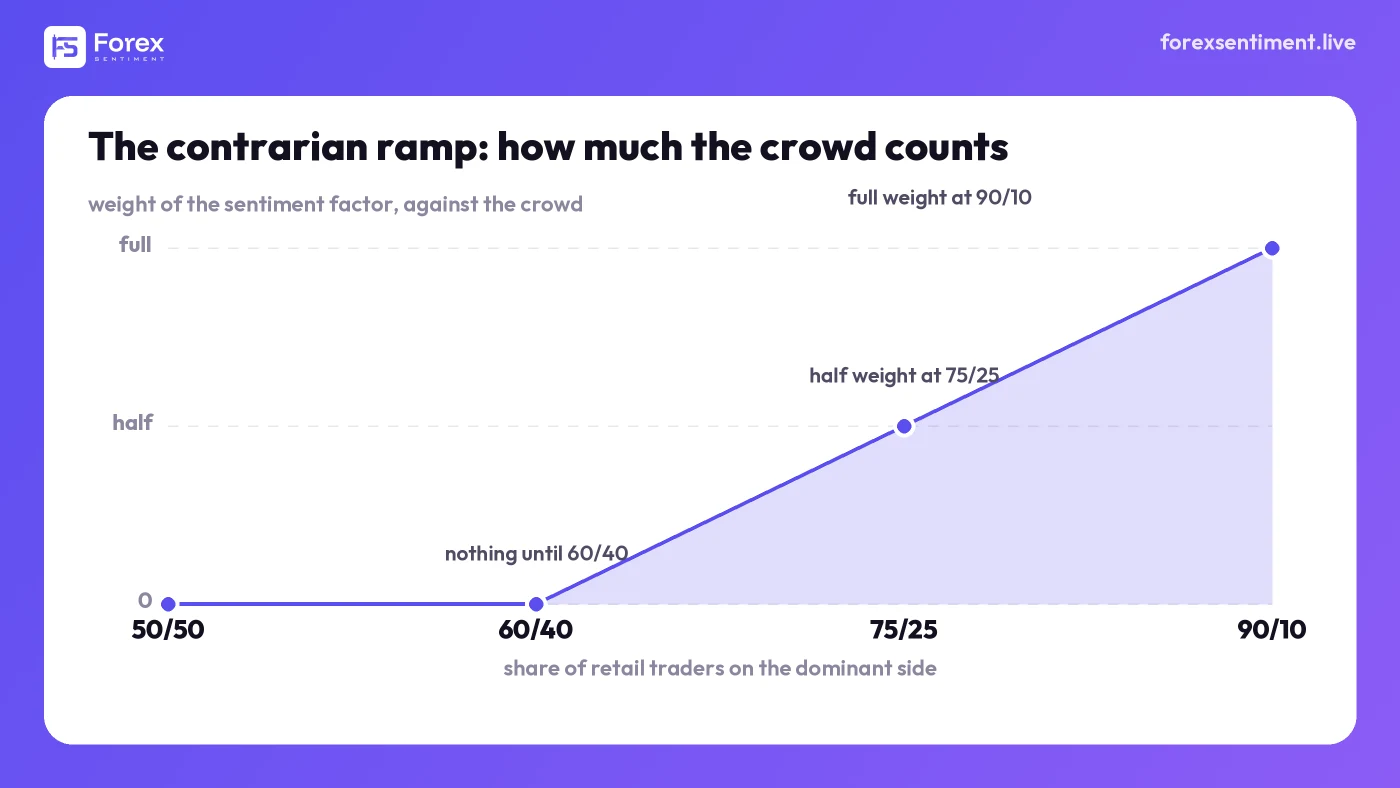
The weight the signal engine gives to the crowd: zero up to 60/40, half at 75/25, full at 90/10, and always against the dominant side.
Two consequences follow. First, a 55/45 reading is not a signal; the engine ignores it, and so should a reader. Second, the reading is only one of five weighted factors in the engine, next to currency strength, chart patterns, support and resistance, and the high-probability zones built on those levels. On the signals page the factor is shown with its own score and the reason it abstained when it did, so a reader can see how much of a signal came from the crowd and how much from elsewhere.
The honest caveat
A contrarian reading is not an independent opinion about the market. Because retail buys dips, "retail is long" and "the price has fallen recently" are close to the same statement, and the engine's factor scores bear it out: measured on the site's own signals, the sentiment factor moves in step with the momentum-based factors far more than with the pattern factor. It is a second look at the direction of the recent move through the eyes of the crowd, useful precisely because it is expressed in a different unit, and misleading if it is mistaken for a fresh vote.
Why the Extremes Look Milder Than the Raw Book
Blending two sources has a cost: it compresses the extremes. The model component of the estimate is deliberately damped and slow, so it rarely strays far from the middle, while real positioning has ranged from single digits into the eighties. Mixing the two pulls every reading toward 50. In a check the site ran on its own feeds in August 2026, a market the real-position source showed at 7% long read 17% in the blend, and a 9% book read 20%.
The practical rule: on this site the Extreme band starts at 75/25 for a reason, and a blended 80/20 or 85/15 is a genuinely lopsided book underneath. The site keeps the blend anyway, because the alternative, showing one raw source, would put a number on the page that no other surface of the platform uses, and consistency across the cards, the engine, the app and the panel is worth more than a sharper extreme.
Reading the History, Not Just the Level
Every pair page carries the long share over the last 7, 21 or 30 days (21 by default), and the panel's Sentiment tab shows the same chart when a row is expanded. Days without a reading are skipped, never filled in. Two things are worth watching there more than the level itself:
- The change over the window. A book that went from 28% long to 66% long in a week has flipped side; the crowd that was fading a rise is now chasing it, which is usually a late position, not an early one.
- How long an extreme has lasted. Extremes can persist. A 78% short book that has been 78% short for three weeks is a fact about the crowd, not a countdown to a reversal, and the ramp above weighs it the same on day one and day twenty. The turn, when it comes, tends to show first in the change, not in the level.
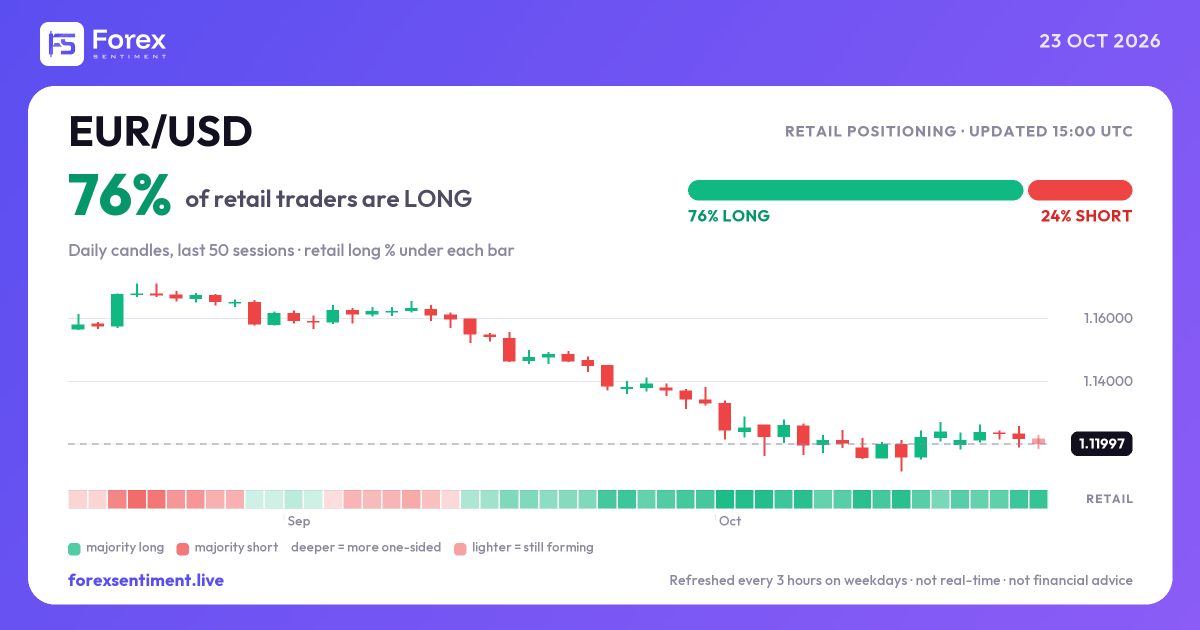
The EUR/USD pair page is the easiest place to see all of this together: the current reading, the chart, the change over the window and the engine's own reading of the pair in the Signal Overview, the section just above the chart.
Where It Shows Up, and What to Do With It
- The homepage: 29 cards with the bar, the two percentages and the dominant side, grouped by market category, with the most bullish and the most bearish book singled out above the grid.
- The pair pages: the reading, its history and the signal engine's read of the same pair.
- The signals: the crowd as one of five factors, with its score shown on every card.
- The MT5 panel: a Sentiment tab with the 29 rows, the crowd bands, the 7, 21 and 30-day history, and two pills per row that show what the engine and the plan of the day say about that pair. Alerts fire when a pair crosses a threshold you choose, 65, 70 or 75% on either side, once per crossing, and optionally when the majority switches side, with the new side at 55% or more. The panel shows the same number as the site, on the chart, one click from the order form.
What to do with it is less glamorous than the marketing of sentiment tools usually suggests. Used well, the crowd is a filter: it argues against joining an extreme, it argues for patience when the book has just flipped, and it adds weight to a level or a pattern that already points the other way. Used alone, it is a coin with a bias that appears mostly at the extremes.
Three Mistakes to Avoid
- Reading it with the crowd. "80% long, so the market is bullish" inverts the statistic. Retail majorities are late far more often than they are early, which is why the engine reads the number against the dominant side, and why the homepage's "bullish" and "bearish" labels are best read as "where the crowd is", not as a forecast.
- Treating a balanced book as information. Below 60% on either side the number says almost nothing, and the engine gives it no weight at all. Waiting for a real majority is the whole discipline.
- Trading it on its own. An extreme tells you where not to pile in; it does not tell you when the turn comes. Pair it with the levels on the site's support and resistance page or with the day's plan, and let the sentiment be the reason to hesitate, not the reason to act.
Related Reading
- Trading with sentiment: how to interpret currency market mood: the broader idea of market mood, beyond retail positioning.
- Sentiment analysis and technical analysis: how to integrate them: pairing the crowd with the chart.
How This Article Was Made
Written from the way ForexSentiment.live computes and displays retail positioning, as documented in the platform's own pages, the signal methodology and the panel's user guide. The 28/72 reading is an illustrative example, not a quote of a specific day. Retail positioning describes where a crowd stands; it is neither advice nor a prediction, and losses in leveraged trading can exceed what a reader has planned for.