A Middle East war can rearrange financial markets in a matter of hours. Some of that repricing is durable and some of it reverses within days, and the difference is not obvious while it is happening.
What follows is the transmission chain, from a headline in the Gulf to a currency pair, and which sectors sit on the profitable side of it, with the caveats that make each one less automatic than it looks.
Why this region moves everything
Two reasons, and both are geographic.
The first is production. A substantial share of world oil and gas output comes from the region, and spare capacity (the ability to increase production quickly if someone else's is lost) is concentrated in the same place.
The second is chokepoints. The Strait of Hormuz and the Bab el-Mandeb are among the most important maritime passages on earth. Before the 2026 conflict, Hormuz alone handled roughly a fifth of global oil and LNG flows. A narrow stretch of water carrying a fifth of the world's energy is a single point of failure that no amount of diversification removes.
When fighting threatens wells, refineries, terminals, pipelines or shipping lanes, markets immediately price the risk that supply falls. Crucially, nothing has to stop moving. It is enough for the probability of interruption to rise, and that probability is repriced within minutes of a headline.
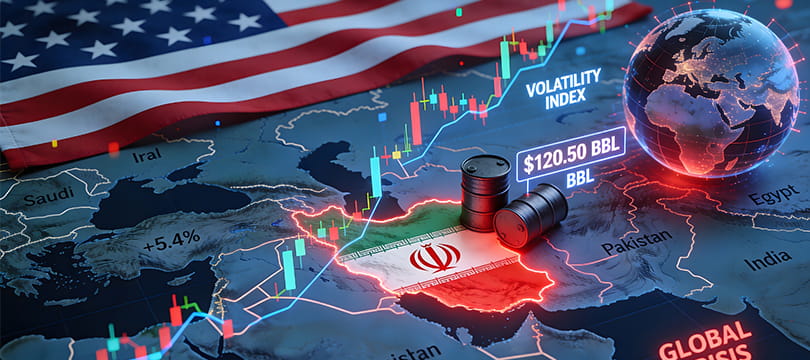
By late August 2026, with traffic through Hormuz still far below normal, Brent was back near $95 a barrel, up between 5% and 8% on the week, after a spike toward $126 in April. The level matters more than the weekly move: a barrel in the mid-90s, months after the opening shock, is what keeps the chain below running.
From there the chain runs outward. Higher energy prices raise costs for businesses and households, which feeds inflation, which changes interest rate expectations. At the same time risk aversion rises: cyclical equities suffer, defensive assets attract flows. Within a session, a regional military event has become a rates story and a currency story.
Energy: the obvious beneficiary, with conditions
If supply is threatened, prices rise. Producers outside the exposed area sell the same barrels for more without the operational disruption, and that is the clean version of the trade.
Two things complicate it.
A producer with infrastructure inside the conflict zone can suffer damage at the same moment the price of its product rises. Owning "oil" and owning an oil company are different exposures, and in a war they can point in opposite directions.
And energy prices high enough for long enough destroy demand. In March 2026 Brent rose about 51% over the month, briefly approaching $120, while the Stoxx 600 lost more than 3% in a single session and the DAX and FTSE MIB nearly 4%. The market priced that as stagflation and rate risk, not only as an import tax. An energy shock is a tax on every economy that imports it, and the equity market prices the tax before it prices the windfall.
Refining: the margin, not the barrel
An underrated corner. When the shortage extends beyond crude to refined products (gasoline, diesel, jet fuel), refining margins widen. The refiner's business is the spread between what crude costs and what fuel sells for, and that spread is not the same trade as the oil price.
In August 2026 Reuters reported unusually high product margins alongside strong gains in several US refining stocks. The distinction matters: a crude producer wants the barrel expensive, a refiner wants the gap wide, and a conflict that disrupts refining capacity specifically can widen the gap even when crude itself is stable.
Defense: real orders, unreliable timing
A widening conflict accelerates military procurement, stockpile replenishment and public spending programs. In 2026 the Indian defense index was up about 33% by mid-June, counted from the start of the Indian fiscal year in April, according to Business Standard, while US missile production contracts were expanded.
The caveat is valuation. Defense equities frequently price years of expected orders within days of a conflict starting, which means the good news is in the price before the contracts are signed. Elevated valuations, shifting military technology and expectations that outrun procurement reality can all produce falls during a war. European defense stocks corrected sharply in spring 2026 while the conflict was ongoing, on first-quarter results that disappointed against very stretched valuations.
Rising orders and rising share prices are related, not the same, and the gap between them is where money is lost.
Safe havens: not as reliable as advertised
Geopolitical uncertainty is supposed to lift gold. It usually does, eventually.
It frequently does not at the start. The opening phase of a crisis is a scramble for liquidity, and investors facing margin calls sell what they can rather than what they want to. Gold is highly liquid, which makes it one of the first things sold.
2026 provided the example, though not a pure one. After the Iran conflict began, gold fell 12% in March, its worst month since June 2013 according to the World Gold Council. ETF outflows and leveraged selling did part of the work; a sharply stronger dollar, rising real yields and a repricing of the Fed after the oil shock did the rest, and the metal stayed weak for months afterward.
The same pattern appeared in March 2020 and in most sharp crises. Gold is usually a haven over weeks and months; March 2026 was the exception, because the shock came with a stronger dollar and a Fed repricing. In the first forty-eight hours it is collateral, and collateral gets sold. The same distinction runs through the comparison between gold and bitcoin as haven assets.
Shipping: the niche that quietly wins
Rerouting around a disrupted chokepoint lengthens voyages. Longer voyages mean each vessel completes fewer trips, which reduces effective fleet capacity without a single ship being lost. Add war risk premiums and the freight rate rises.
Tanker rates in particular can move dramatically, and the effect can outlast the conflict, because vessels displaced onto longer routes stay displaced until the routing normalizes. This is one of the few places where a geopolitical shock produces a durable earnings change rather than a sentiment move.
The currency side
For a foreign exchange trader the chain ends here, and it is more tractable than the equity story.
Energy exporters versus importers. An oil shock is a terms-of-trade transfer. Currencies of net exporters, the Canadian dollar and the Norwegian krone among them, tend to strengthen. Currencies of energy importers tend to weaken: the euro among developed markets, and most emerging market currencies. The mechanism is the import bill, and it is arithmetic rather than sentiment.
The yen is the awkward case. Japan imports almost all of its energy, which argues for a weaker yen, but the currency is also a haven that strengthens when risk is being sold, so the two legs pull in opposite directions. In energy-led shocks the import bill has tended to win, and a weaker yen rather than a stronger one has been the usual outcome.
The dollar gains twice. As the reserve currency in a risk-off episode, and because the United States is far less energy-import-dependent than it once was.
Inflation feeds back into rates. A sustained energy price rise complicates every central bank's job, and the market reprices policy paths accordingly. That repricing shows up in yield spreads, which is where currency direction is usually decided.
Four rules for trading it
A conflict is not a buy signal. "War means oil up" and "war means gold up" are simplifications that work in some phases and fail badly in others, as gold demonstrated in March 2026.
Identify what is actually being priced. Supply disruption, military spending, a liquidity scramble, inflation, or the odds of a ceasefire. These are different trades with different time horizons, and they take turns.
Reduce leverage. News arrives when markets are closed. Gaps make stop losses unreliable and slippage severe, and a position sized for normal conditions is oversized for these.
Do not chase an extended move. Entering because the price is rising exposes you to a de-escalation that arrives as suddenly as the escalation did. The reversals on diplomatic headlines are as fast as the original moves.
The pattern under the headlines
Middle East conflicts are not identical, but the chain they run through is. Threatened supply raises energy prices, energy prices raise inflation, inflation moves rate expectations, and rate expectations move currencies and equity valuations. Everything else is detail about which link is doing the work today.
Energy producers outside the zone, refiners with wide margins, defense contractors and tanker owners are the recurring beneficiaries. Airlines, chemicals, transport, energy-intensive manufacturing and energy-importing economies are the recurring payers.
And the same caution applies to all of it: a sector rising because input costs have risen is not evidence that anything is going well. It is usually evidence of the opposite.