PropTradingStat.com is a web platform built specifically for prop firm traders who want to track precisely how much they spend on challenge fees, how much they earn from payouts, and what return each firm is actually delivering. The problem it addresses is concrete: if you use three, four or five different prop firms, such as FTMO, Apex Trader Funding, TopStep, My Funded Futures, E8 Funding or Bulenox, the challenge fees accumulate, the payouts arrive at irregular intervals, and there is no simple way to know whether you are genuinely profitable or just funding a cycle of expenses with no return.
This review covers how Prop Trading Stat works, its main features, what it actually costs including the free tier, and above all whether it is worth using given the brutal statistics of prop trading: industry analysis by FPFX Tech across more than 300,000 accounts indicates that only around 7% of traders who buy a challenge ever receive a payout, and that the average trader spends roughly $4,270 on challenges before becoming profitable.
The Problem It Solves: Prop Trading Accounting
Prop trading has a very different economic model from ordinary retail trading. In retail, you deposit money with a broker, you trade, the profit and loss sits in your account, and that is the whole picture. In prop trading: you pay a challenge fee, you receive a funded account if you pass, you receive a payout, typically 80 to 90% of profits, if you make money on that funded account, and you lose the account and have to buy a new challenge if you breach the rules on maximum drawdown or daily loss.
Challenge fees vary considerably by market. CFD and FX prop firms such as FTMO or E8 Funding start from roughly $100 to $200 for accounts of $10,000 to $25,000, while futures firms like Apex Trader Funding or TopStep charge in the region of $50 to $250 for accounts of $50,000 to $150,000. Whichever market you trade, the outcome is the same: run several firms simultaneously and the expenses accumulate quickly, making it genuinely difficult to establish whether you are earning or just moving money between accounts.
A concrete example. You have spent $800 on FTMO across four $200 challenges, $600 on E8 Funding across three $200 challenges, and $600 on Apex Trader Funding across two $300 challenges. Total spent: $2,000. You have received two payouts from FTMO of $1,200 and $1,800, plus one payout from Apex of $900. Total received: $3,900. Your net P/L is +$1,900 and your overall ROI is +95%. Prop Trading Stat shows that at a glance, and it also breaks the return down by firm: FTMO at +275%, Apex at +50%, E8 Funding at -100%. That per-firm view is the part most traders never calculate.
How It Works: Manual Tracking
Prop Trading Stat is a manual tracking system. It does not connect automatically to your prop firm accounts. That means you log each transaction yourself: when you buy a challenge, you add an expense record with the amount and the firm name. When you receive a payout, you add an income record. When you buy a reset after failing, another expense.
The manual approach has genuine advantages and disadvantages. On the plus side: no need to hand credentials to a third-party platform, so no security exposure; it works with any prop firm rather than only those with an official API; and it is fast, since logging a transaction takes about ten seconds. On the minus side: it requires discipline, because you have to remember to log everything; it is not real time, so if you skip a payout for two weeks your data is stale; and manual entry introduces the risk of typos corrupting the numbers.
The platform supports all the main prop firm markets: CFD, futures, crypto and stocks. You can add multiple firms, mix different types within the same account, and filter data by firm, month or year. An active trader running 15 to 25 challenges a month is logging 25 to 50 transactions monthly. A more cautious trader doing one or two challenges a month needs only three to five. Either volume is entirely manageable without automation.
The Main Features: Dashboard, Analytics and Firm Comparison
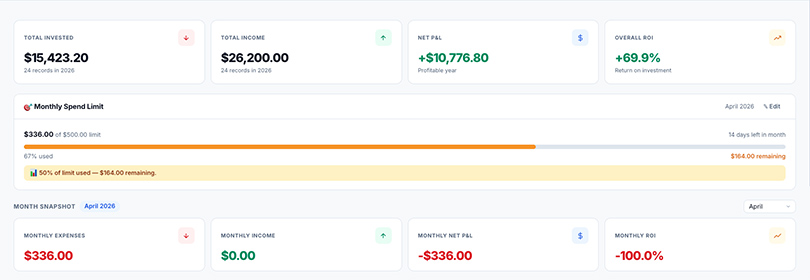
The central dashboard shows the headline figures: Total Invested, covering everything spent on challenges and resets; Total Income, covering all payouts received; Net P&L, being income minus invested; and Overall ROI as a percentage. Below that sits a Month Snapshot with the current month's data: monthly expenses, income, net P&L and ROI, plus a bar chart of the trailing twelve-month trend, which makes it immediately visible whether the direction is positive or negative.
The Analytics section adds interactive charts: a monthly trend comparing income against expenses, a breakdown table by prop firm, and comparison charts across months and years. The Pro tier unlocks more advanced analysis. A calendar heatmap displays each month as a coloured square: green for profitable, red for a loss, which surfaces seasonal patterns at a glance. Streak statistics show your current run of profitable months and your personal best.
The Compare Prop Firms feature, also Pro, is arguably the most useful of all: it shows your ROI, income and expenses side by side across every firm you have used. A concrete case: FTMO returning +180%, E8 Funding +25%, Apex Trader Funding -100%, Bulenox -50%. The conclusion writes itself: concentrate on FTMO, keep testing E8, stop using Apex and Bulenox. Without this view, a great many traders keep spending on firms that have never worked for their particular style.
Free Versus Pro: What Actually Changes
Prop Trading Stat offers a free-forever plan with a limit of 50 total records. Each transaction, whether expense or income, counts as one record. If you use two or three firms and average three to five transactions a month, 50 records gives you roughly 10 to 16 months of data, close to a year and a half at a normal pace. For someone running many challenges monthly at five to ten transactions, the limit arrives within five to ten months.
The free plan includes the full dashboard with all headline figures, basic analytics covering monthly trend, per-firm breakdown and year-on-year comparison, support for up to 50 prop firms, monthly and annual goals where you can set an income or ROI target, and achievement badges awarded at milestones such as a first payout or a five-month profit streak.
The Pro plan at $19.99 per month, or $49.99 quarterly, or $149.99 annually, which works out to $12.50 a month and saves about 37%, unlocks unlimited records, the advanced charts including streak statistics and the calendar heatmap, the Compare Firms feature, goal templates with 17 ready-made presets, custom alerts when monthly P/L crosses a threshold, a monthly spend limit with progressive alerts at 50, 75 and 90%, an automated monthly email digest, CSV and Excel import and export, PDF report export, a public stats profile for displaying your track record, and priority support.
Is $19.99 a month worth it? It depends on how serious you are. If you have run one or two challenges and are not certain you will continue, the free tier is more than sufficient. If you are treating prop trading as a genuine activity, spending $400 or more monthly on challenges, using three or more firms, trying to optimize return, then $19.99 is a small outlay relative to what you save by avoiding firms that do not suit you. A single wasted month on the wrong firm costs $100 to $400 in fees; if the tool helps you identify that earlier, it pays for itself.
The Brutal Statistics It Makes Visible
One indirect benefit of using a tool like this is that it forces you to confront the real numbers of your own prop trading, and those numbers are frequently far less flattering than traders assume. The FPFX Tech industry analysis cited earlier found that only around 14% of traders pass a challenge, and of those, only about 7% go on to receive a payout. The average trader spends close to $4,270 on challenge fees before becoming profitable. The average payout is only about 4% of the funded account size, meaning a $100,000 account generates around $4,000 in payouts on average.
When you start tracking everything, those figures become personal. You see exactly what you have spent: perhaps $2,000 over six months, exactly what you have earned, perhaps $500, and a net P/L of -$1,500. That is a genuine shock for many traders who believed they were close to break-even. The reality is that prop trading has an expensive learning curve, and most traders quit before becoming profitable precisely because they never tracked how much they were actually losing while continuing to believe they were nearly there.
Tracked properly, the data gives you an objective basis for two decisions. When to stop: if after ten challenges and $3,000 spent you still have no payout, prop trading may not be for you. And when to concentrate: if one firm is returning +200%, that is where the capital should go rather than being spread across firms delivering -50%. A related article on the five mistakes that get traders eliminated from challenges covers the behavioral side of the same problem.
The Alternatives: Excel Versus a Dedicated Tool
The obvious alternative is a simple spreadsheet in Excel or Google Sheets. You create columns for date, prop firm, type, amount and notes, and calculate total invested, total income, net P/L and ROI manually. It is entirely free and gives you complete control over the data.
The advantages of a spreadsheet: zero cost, maximum flexibility since you can add any custom field, data fully under your control with no risk of a web service shutting down, and the ability to run advanced analysis with pivot tables or complex formulas. For a beginner who has run two or three challenges on a single firm, a spreadsheet is entirely sufficient: updating it takes two or three minutes a week.
For a trader running four or more active firms who wants visual analytics such as calendar heatmaps, streak statistics and comparison charts, a dedicated tool saves enough time to justify $20 a month. The practical rule: if you spend under $200 a month on challenges across one or two firms, a spreadsheet is enough. If you spend $500 or more across multiple firms, Prop Trading Stat Pro becomes worth considering.
Other alternatives include general-purpose journal software such as Edgewonk or TradesViz. Those are focused primarily on tracking individual trades: entry price, exit price, per-trade P/L, win rate, rather than on tracking challenge fees and payouts at the firm level. You can force them to do this too, but they are not optimized for it.
Limitations and Risks
The main limitation is that Prop Trading Stat is purely a tracking tool. It performs no analysis of your actual trades. It tells you what you spent and what you earned at the macro level, but it does not tell you why you are losing money. If you are failing every challenge because you keep breaching the daily loss limit, Prop Trading Stat will not surface that. You need a separate tool, such as the prop firm's own journal or something like Edgewonk, to identify the patterns in your trading errors. The guide to calculating trading expectancy covers the metrics that answer that question.
The second limitation is the dependence on manual tracking. If you forget to log transactions for two or three months, your data becomes incomplete and effectively unusable. There is no automated way to recover it: you would have to go back through confirmation emails for challenge fees and payouts and reconstruct everything by hand.
Who Should Use It and Who Should Not
You should use Prop Trading Stat, at least the free plan, if: you run two or more prop firms and struggle to track mentally what you have spent and earned on each; you have already spent over $1,000 on challenge fees and want to know whether you are actually net profitable; you want to identify which firm is delivering the best return; or you are the kind of person motivated by visual data such as charts, badges and streaks.
You should pay for Pro if: you use three or more firms actively; you will exceed 50 records within the first year, meaning more than four transactions a month on average; you want the advanced analysis to optimize strategy, where Compare Firms is genuinely useful for deciding where to concentrate; you want a public profile to build credibility; or you already have a positive return and want to maintain momentum through alerts and the monthly digest.
You should not use it if: you have run only one or two challenges and are not sure you will continue, in which case it is too early and a spreadsheet is enough; you prefer total control over your data and are comfortable in Google Sheets; you are not willing to log transactions consistently; or your budget is tight enough that $20 a month is material relative to what you spend on challenges.
The Verdict
For the free plan: absolutely worth trying. It costs nothing, gives you 50 records which covers many months of data, and even simply seeing your aggregate net P/L can be a useful reality check. The worst outcome is that you register, log a few transactions, decide it is not for you, and close the account. Zero cost, zero risk.
For the Pro plan at $19.99 a month: it depends on your volume and how seriously you are approaching this. If you are spending $600 or more monthly on challenge fees, meaning $7,200 or more annually across all firms, then the $149.99 annual plan is about 2% of your total budget. If it improves your return by even 5%, by helping you drop a firm that does not suit your style, or identify the one to concentrate on, it repays itself comfortably. If you are spending $200 to $300 a month, the annual plan is 4 to 6% of budget: acceptable if you are data-driven, but a spreadsheet is probably sufficient.
The practical recommendation: start with the free tier and use it until you hit the 50-record limit. By then you will have enough data to establish whether prop trading is working for you, with a positive return, or not. If it is positive and you want to scale across more firms simultaneously, upgrading to Pro makes sense mainly for the Compare Firms feature. If it is negative, the more useful conclusion is to stop. Do not spend further money on either challenges or tracking tools. For the broader question of whether this route suits you at all, see the comparison of prop trading versus personal trading.