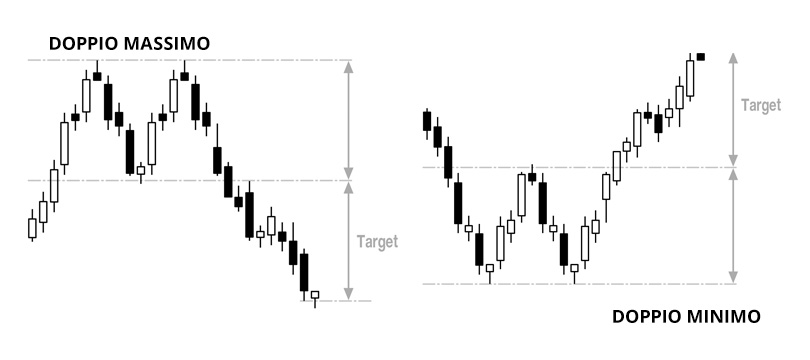
The double top and double bottom are probably the best known and most reliable reversal patterns in technical analysis. Their popularity is not accidental: they are easy to identify even for beginners, they have clear market logic behind their formation, and they provide well-defined entry, stop loss and target levels. That combination is why they appear in practically every trading manual and why thousands of traders are watching for them simultaneously.
But precisely because they are so widely known, they need to be understood properly to avoid the traps. A double top that looks perfect can turn out to be a false signal, and a great many traders lose money by entering too early, before confirmation. This article covers how these patterns form, the market logic that makes them reliable, how to trade them with proper risk management, and the most common errors to avoid.
What a Double Top Is
A double top is a bearish reversal pattern that forms at the end of an uptrend. Its shape resembles the letter M: price rises to a first peak, falls back to form a valley, rises again to a second peak at roughly the same level as the first, and finally breaks down through support. When price breaks the level of the central valley, called the neckline, the pattern is confirmed and signals the start of a downward move.
The market logic behind it is intuitive. During an uptrend, price advances until it meets resistance where sellers take control. Price falls back, but buyers try again to push it higher. It returns to the same resistance level and this time fails to clear it: sellers are stronger again. That failure to make a new high is the signal that upside momentum has been exhausted. Buyers attempted the resistance twice and were rejected both times.
A valid double top has several important characteristics. The two peaks should sit at approximately the same level: on equities the usual guide is a difference of no more than around 3 to 4 percent, while in FX the tolerance is a small fraction of that (the pattern detector on this site, for instance, treats two peaks as "the same level" only within 0.15 percent, and asks for a valley of at least 0.3 percent and at least five bars between the two pivots). The central valley needs meaningful depth to indicate genuine weakening rather than noise: on equities the conventional guide is a pullback of 10 to 15 percent from the highs, but in FX, where percentage moves are much smaller, the useful test is whether the valley retraces a significant share of the preceding advance, commonly a third or more, or spans several times the average daily range. And enough time should elapse between the two peaks, at least a few weeks on a daily chart, to indicate a real contest between buyers and sellers rather than short-term noise.
What a Double Bottom Is
The double bottom is the exact inverse: a bullish reversal pattern that forms at the end of a downtrend. Its shape resembles the letter W: price falls to a first low, rises to form a peak, falls again to a second low at roughly the same level as the first, and finally breaks up through resistance. When price breaks the level of the central peak, again the neckline, the pattern is confirmed and signals the start of an upward move.
The logic mirrors the double top. During a downtrend, price falls until it meets support where buyers step in. Price rises, but sellers try again to push it lower. It returns to the same support level and this time fails to break through: buyers are stronger again. That failure to make a new low signals that selling pressure has been exhausted. Sellers attempted the support twice and failed both times.
The double bottom tends to be marginally more reliable than the double top, for an interesting psychological reason. Market lows frequently form in conditions of panic and capitulation, where sellers exhaust their force quickly. Highs, by contrast, often form in conditions of euphoria that can persist longer and produce more attempts at a breakout. That is a statistical tendency rather than a rule, though: both patterns require confirmation before they are traded. The earlier piece on the double bottom pattern in forex covers that formation on its own.
The Neckline: The Level That Confirms Everything
The neckline is the most important element of both patterns, because it is the level whose break confirms the reversal. In a double top, the neckline is the horizontal level drawn at the low of the central valley. As long as price stays above the neckline, the pattern is not confirmed and could still resolve as a continuation of the uptrend. Only when price closes decisively below the neckline is the double top validated.
In a double bottom, the neckline is the horizontal level drawn at the high of the central peak. As long as price stays below the neckline, the pattern is not confirmed. Only when price closes decisively above it is the double bottom validated and a long entry worth considering.
The most common beginner error is entering before the neckline breaks. They watch the second peak form and short immediately, reasoning this is a double top, it will fall. But until the neckline is broken there is no confirmed double top: price could simply make a third attempt and clear the resistance to the upside, turning the supposed reversal pattern into a trend continuation. Waiting for confirmation costs a few points of potential profit and eliminates a very large number of false signals. The guide to market entry timing covers the same principle applied to breakouts more generally.
How to Trade a Double Top
The classic approach is to enter short when price breaks the neckline to the downside. The ideal entry is at the close of the candle that breaks the neckline, or on a subsequent pullback toward the broken neckline, which flips from support to resistance. Waiting for the pullback offers a better entry price and a tighter stop, but sometimes the pullback never arrives and the trade is missed entirely.
The stop loss belongs above the second peak, with a small buffer to avoid being taken out by a volatility spike. Take a concrete example on EUR/USD: the two peaks form at 1.1000 and the neckline sits at 1.0900. The stop goes at roughly 1.1020. That defines the risk clearly: if price returns above the highs, the pattern has failed and you exit.
The profit target is calculated using the measured move method. Measure the vertical distance between the peaks and the neckline, then project that same distance downward from the neckline. With peaks at 1.1000 and the neckline at 1.0900, the distance is 100 pips, so the target is 1.0800.
Now look at what that means for risk and reward, because this is where most descriptions of the pattern stop short. Entering at the neckline break at 1.0900 with a stop at 1.1020 means risking 120 pips to make 100, a ratio of about 1:0.83, which is genuinely poor. Entering instead on a pullback to 1.0960, with the same stop at 1.1020, means risking 60 pips to make 160, a ratio of about 1:2.7. Same pattern, same stop, same target, and more than a threefold improvement in the arithmetic. That is the real reason experienced traders wait for the retest, and it matters far more than any refinement to how the pattern is identified.
How to Trade a Double Bottom
The approach for the double bottom is symmetrical. You enter long when price breaks the neckline to the upside, ideally at the close of the breakout candle or on a pullback toward the neckline, which flips from resistance to support. The stop loss goes below the second low with a safety buffer.
The target is calculated the same way: measure the distance between the lows and the neckline and project it upward from the neckline. If the lows sit at 1.0500 and the neckline at 1.0600, the distance is 100 pips and the target is 1.0700. The same reasoning about pullback entries applies, and for the same arithmetic reasons.
One additional factor matters for both patterns: volume. In a valid double bottom, volume tends to decline during the formation, a sign that sellers are exhausting themselves, and then increase significantly on the neckline break, a sign that buyers are entering with conviction. A neckline break on low volume is suspect and considerably more likely to be a false breakout. Volume confirmation is not mandatory, but it improves reliability meaningfully. In FX, where centralized volume does not exist, tick volume from your platform is an imperfect but usable proxy.
False Signals: When the Pattern Does Not Work
Despite their relative reliability, double tops and double bottoms still generate false signals, and knowing when to be skeptical is essential. The most common failure is the false neckline break: price breaks the neckline, triggers everyone's entries, then reverses quickly in the opposite direction, stopping out everyone who entered. This happens particularly often when the pattern is too obvious and many traders enter simultaneously, creating exactly the conditions for a move against them driven by participants who want to run those stops.
A second problem is the context of the broader trend. A double top forming inside an extremely strong and structurally healthy uptrend is much less likely to work than one forming after a trend that is already mature and tired. Reversal patterns work best when the preceding trend already shows signs of exhaustion: RSI divergences, declining volume, fading momentum. Trading a double top against a trend that is still strong is a low-probability proposition.
The third problem is pattern quality. Many of the double tops beginners believe they see are not real patterns at all: the two peaks are too far apart in level, more than 4 or 5 percent different, or the central valley is too shallow, or the time between the peaks is too short. A low-quality pattern has substantially lower reliability. Wait for clear, well-defined structures rather than forcing an interpretation onto an ambiguous one.
Triple Tops and Triple Bottoms
Variants of these patterns exist with three touches instead of two: the triple top and triple bottom. The logic is identical, with one additional attempt. In a triple top, price tries three times to break the same resistance and fails all three before breaking the neckline to the downside. These patterns are less common but tend to be more reliable, because three consecutive failures indicate an even clearer exhaustion of momentum than two.
The trade-off is that triple patterns require more patience and complete less frequently. Often a pattern that appeared destined to become a triple top instead turns into an upside breakout on the third attempt. That is why many traders prefer to trade the double patterns, accepting slightly lower reliability in exchange for greater frequency of opportunity.
Why the Timeframe Matters
The reliability of these patterns increases with the timeframe. A double top on a monthly or weekly chart is far more reliable than one on a five-minute chart. The reason is simple: the higher the timeframe, the more capital and the more institutional decisions are involved in forming the pattern, and the more significant the signal. A weekly double top reflects months of contest between buyers and sellers; a five-minute one reflects a few hours of intraday noise.
For swing traders and position traders, patterns on daily, weekly and monthly charts are the most useful. For day traders operating on lower timeframes of five to fifteen minutes, these patterns can still work but with lower reliability and considerably more false signals. The practical rule is straightforward: the higher the timeframe, the more you can trust the pattern, but the less often it will appear.
Reliable, Not Infallible
Double tops and double bottoms are among the most reliable reversal patterns in technical analysis, which is why they have remained popular after decades of use. Their market logic is clear — a failure to make new highs or lows signals trend exhaustion — they offer well-defined entry, stop and target levels, and they are relatively easy to identify.
But reliable does not mean infallible. They still generate false signals, they work better in some contexts than others, and they always require confirmation of the neckline break before being traded. The most expensive error is entering before confirmation, anticipating a pattern that may never complete. The patience to wait for the break, combined with disciplined risk management — a stop always in place, a favorable risk-to-reward ratio, correct position sizing — is what separates traders who use these patterns profitably from those who use them to lose money.
As with every technical analysis tool, double tops and double bottoms are not magic systems but components of a broader approach. Combined with an assessment of trend context, volume confirmation, and attention to the appropriate timeframe, they can be genuinely valuable. Used in isolation, with unrealistic expectations of precision, they produce nothing but frustration. Reading them well starts with understanding the support and resistance levels that give them their meaning in the first place.